


The daily chart of XRP reveals that XRP has recently attempted to break out of a descending trendline that has defined much of its downtrend. However, price action is struggling to maintain bullish momentum. After a temporary push above $2.18, sellers have reclaimed control, pulling the price back below the critical trendline. The Bollinger Bands on the daily timeframe are relatively stable, with price hovering near the midline, signaling a period of consolidation. The MACD on the daily chart is still above the signal line, but the histogram is fading, indicating weakening bullish strength. This sets the stage for a possible retest of lower support zones if buying pressure doesn’t return.
4-Hour Chart Analysis and Pattern Behavior
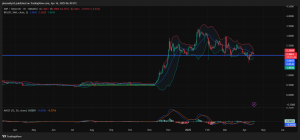
On the 4-hour chart, XRP shows more pronounced price action. The pair had previously broken above the descending trendline with a strong impulse move, but this move now appears to be fading. A bearish rejection has pushed XRP back to $2.06, just above the confluence of two key supports at $2.0735 and $2.0143. The structure hints at a potential bull trap if the price fails to bounce convincingly. A small descending triangle is forming—a bearish continuation pattern—while the Bollinger Bands are contracting again, indicating a squeeze that could soon lead to volatility. The MACD has crossed bearishly with the signal line now above the MACD line and the histogram in negative territory, hinting at downside risk.
1-Hour Chart Insights and Short-Term Momentum
The 1-hour chart presents an even tighter narrative. A mini double top formation has developed near the $2.18 level, further confirming resistance strength. The price has since broken below short-term support and is now flirting with the ascending trendline that had previously guided the bullish move. The Bollinger Bands here are wide, with the price near the lower band, showing oversold conditions. However, the MACD remains negative, and the histogram bars are increasing in size downward—suggesting growing bearish momentum. A short-term bounce might occur, but the overall picture points toward cautious trading.
Support and Resistance Zones to Watch
Key support levels across the three timeframes converge around $2.0735, $2.0143, and $1.95. These zones represent potential bounce regions if selling intensifies. On the resistance side, the $2.18 level remains the most immediate ceiling. A break above this with high volume could reinstate the bullish case, targeting $2.40 and $2.60 subsequently. Conversely, if the $2.01 level gives way, XRP may revisit lows around $1.85 or even $1.75 before stabilizing.
We are on twitter, follow us to connect with us :- @TimesTabloid1
— TimesTabloid (@TimesTabloid1) July 15, 2023
Bollinger Bands and Volatility Expectation
The narrowing of the Bollinger Bands on the 4-hour and daily charts suggests a buildup of pressure, typically preceding a large price movement. If this squeeze breaks upward, a strong rally may follow. But since the price is currently leaning toward the lower half of the band, bears have a slight edge. On the 1-hour chart, the price hovering near the lower band supports the idea of a short-term bounce, though broader trend indicators still lean bearish.
MACD Indicator Across Timeframes
The MACD on all three timeframes shows weakening bullish strength. While the daily MACD is technically still bullish, its fading histogram suggests the bulls are losing steam. The 4-hour and 1-hour MACDs have already crossed bearishly, showing that momentum is currently with the sellers. This reinforces the importance of holding the $2.01–$2.07 support region. If bulls can flip the MACD lines back upward, it could reignite buying interest.
Price Prediction for Today
Given the current technical landscape, XRP is likely to trade within a compressed range today. A bounce from $2.06 could push the price to retest the $2.13–$2.18 resistance, but this may be short-lived if volume doesn’t support it. If selling pressure continues and $2.06 fails to hold, XRP could revisit the $2.01–$1.95 range before finding a stable footing. Therefore, the projected price range for today is between $1.95 and $2.18, with a slight bearish bias unless buyers reclaim control with volume confirmation.
Disclaimer: This content is meant to inform and should not be considered financial advice. The views expressed in this article may include the author’s personal opinions and do not represent Times Tabloid’s opinion. Readers are urged to do in-depth research before making any investment decisions. Any action taken by the reader is strictly at their own risk. Times Tabloid is not responsible for any financial losses.
Follow us on X, Facebook, Telegram, and Google News