


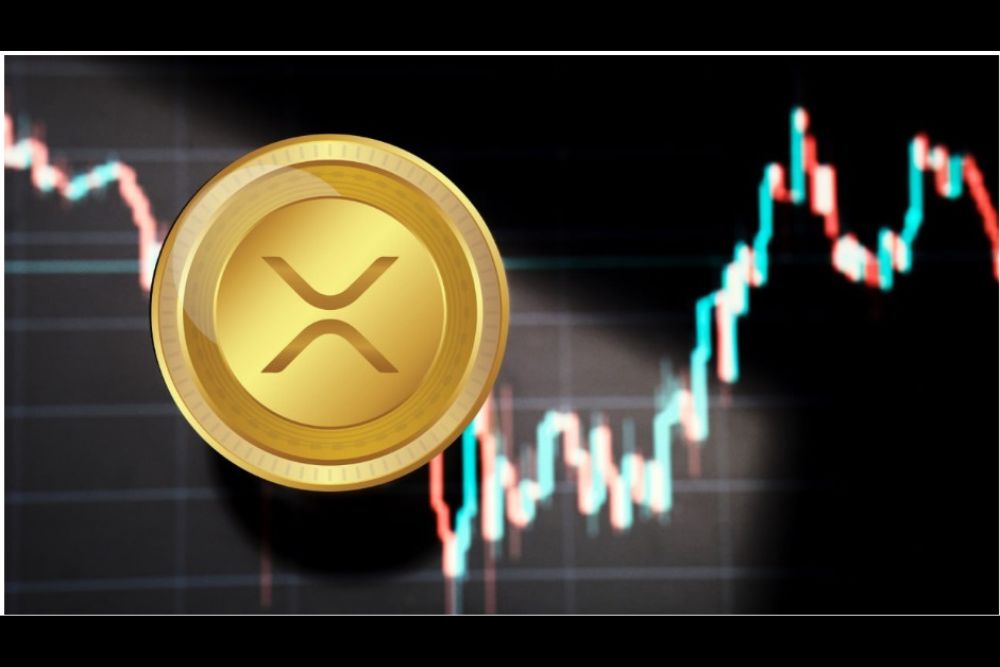
Crypto analyst Ash Crypto (@AshCrypto) posted a weekly XRP chart showing a clear multi-monthly resistance zone sitting between approximately $1.50 and $1.60. XRP has been compressed below this level for months. He stated that once it breaks, $2 becomes an easy target.
The chart tells a structured story. XRP peaked above $2 when it pumped in early 2026 before selling off sharply through the first quarter. The asset bottomed near $1 in August, then staged a strong rally back toward the resistance zone.
That rally failed at the same ceiling that has rejected the asset multiple times throughout the year. Since then, XRP has pulled back to around $1.32.
$XRP has been stuck below this resistance for months.
Once it breaks, $2 will be easy. pic.twitter.com/4QIH8PSeW1
— Ash Crypto (@AshCrypto) October 23, 2026
What the Chart Shows
Three cup-shaped formations appear across the chart at different time intervals. Each one marks a period of accumulation followed by a push higher. The most recent formation is developing near current price levels around $1.32.
The resistance zone around $1.50 to $1.60 has acted as a ceiling repeatedly. Each test of that zone has resulted in a rejection, but the repeated tests also suggest sustained buying pressure beneath it.
A confirmed break above $1.60 on a weekly close would remove the primary obstacle between current price and the $2 level. While the rally in September pushed XRP above this level, it was unable to sustain the momentum. Ash Crypto’s analysis points to that outcome as the precursor to the next major move.
Community Reactions
The post drew a range of responses, and not all of them aligned with the bullish outlook. One respondent pushed back on the timeline entirely. He argued that XRP has been underperforming for years, not months, and said he knows people who are now exiting their positions.
Another took a more technical view. He agreed that XRP would move to $2 quickly once the resistance wall breaks. One commenter questioned what confirmation would look like. He asked whether a daily close above the level would be sufficient or whether more evidence is needed.
The Level to Watch
The $1.50 to $1.60 zone remains the key area. XRP is currently trading at $1.3212. The structure on the chart suggests accumulation is ongoing. A weekly close above resistance would shift the technical picture significantly and open the path toward $2.
Disclaimer: This content is meant to inform and should not be considered financial advice. The views expressed in this article may include the author’s personal opinions and do not represent Times Tabloid’s opinion. Readers are advised to conduct thorough research before making any investment decisions. Any action taken by the reader is strictly at their own risk. Times Tabloid is not responsible for any financial losses.
Follow us on X, Facebook, Telegram, and Google News

