


XRP has entered a decisive phase as the weekly chart reveals a sharp rejection from multi-month highs and a breakdown below key support levels. Over the last 7 weeks, bearish pressure has intensified, and the structure is showing multiple reversal signals, with further downside possible unless bulls reclaim critical zones.
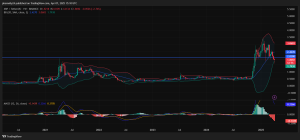
Chart Patterns
- Head and Shoulders (Weekly):
A large head and shoulders pattern is visible between late 2024 and early 2025. The left shoulder formed around $2.80, the head at $3.60+, and the right shoulder again around $2.80–$3.00. The neckline near $2.03 has now been broken, confirming a major bearish reversal.
- Rising Wedge Breakdown:
From late 2023 to February 2025, XRP formed a rising wedge — a bearish continuation pattern. The recent candle breakdown aligns perfectly with this pattern, indicating that bearish momentum may accelerate toward $1.60 and $1.35.
- Double Top:
A clear double top is visible around the $3.60 region. The break below $2.03 confirms this pattern and suggests further downside as the measured move target points toward the $1.30 range.
- Bearish Engulfing (Recent Week):
This week’s candle forms a large bearish engulfing bar relative to the previous bullish candle, reinforcing bearish dominance and increased seller conviction.
Indicator Analysis
Bollinger Bands (20, SMA):
Price has broken below the mid-band (20 SMA), suggesting a shift from bullish to bearish territory. The lower band is opening, and XRP is moving toward it, showing expansion and increasing volatility to the downside.
MACD (12, 26):
The MACD has crossed bearishly and is now accelerating downward with a growing red histogram. This confirms a momentum shift in favor of sellers and hints at continued downward pressure over the next few weeks.
EMA (50-week):
The price is currently testing the 50-week EMA, which lies around the $1.77–$1.80 range. A weekly close below this EMA would mark a critical shift in trend structure, turning medium-term sentiment bearish.
RSI :
RSI is likely declining toward the 40 mark, indicative of waning momentum but not yet oversold. If RSI breaks below 40, it may open up more downside room.
Key Levels
- Immediate Resistance: $2.03, $2.42
- Immediate Support: $1.77
- Deeper Support Zones: $1.60, $1.35
- Major Resistance (Recovery Target): $2.80, $3.00
Fundamental Backdrop
XRP’s recent weakness is closely tied to regulatory stagnation in the SEC case, despite broader crypto market optimism. While Ripple has expanded ODL (On-Demand Liquidity) corridors globally and XRP Ledger developments remain positive, institutional caution prevails.
We are on twitter, follow us to connect with us :- @TimesTabloid1
— TimesTabloid (@TimesTabloid1) July 15, 2023
Moreover, the lack of ETF inclusion for XRP (unlike BTC/ETH) keeps sidelining investor interest. Macroeconomic headwinds, including a hawkish Fed and reduced liquidity in altcoins, compound XRP’s downside.
Price Action Outlook
Unless XRP reclaims the $2.03 level and holds above the 20-week SMA, the pair risks further losses toward $1.60 and even $1.35 in the next 3–5 weeks. Any bounce into the $2.00–$2.30 zone could offer short opportunities unless volume returns with bullish divergence.
The trend remains decisively bearish. Reversal requires strong bullish divergence, rising volume, and reclaim of $2.42. Until then, XRP may consolidate lower or form a base before a fresh upside phase can begin.
Disclaimer: This content is meant to inform and should not be considered financial advice. The views expressed in this article may include the author’s personal opinions and do not represent Times Tabloid’s opinion. Readers are urged to do in-depth research before making any investment decisions. Any action taken by the reader is strictly at their own risk. Times Tabloid is not responsible for any financial losses.
Follow us on X, Facebook, Telegram, and Google News