


XRP is trading around $1.749, showing signs of sustained selling pressure on the 1-hour chart. With multiple indicators aligning to bearish sentiment, the chart also hints at a potential short-term rebound, contingent on support holding at a critical level. This analysis breaks down the current state of XRP using multiple timeframes, technical patterns, and three core indicators: Bollinger Bands (BB), MACD, and the 20-period Simple Moving Average (SMA20).
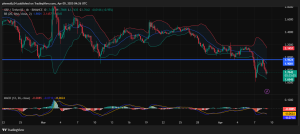
Bearish Momentum Still in Control
The XRP price has experienced a sharp decline since April 7, falling from above $2.00 to a low near $1.73. A clear bear flag pattern formed during the brief consolidation phase between $1.85 and$1.95, which eventually broke down. This bearish continuation was reinforced by the MACD indicator, which showed a bearish crossover and negative histogram flip. Additionally, the price has been consistently rejected by the SMA20, serving as a dynamic resistance.
Key Chart Patterns Identified
- Bear Flag Breakdown
The flagpole began on April 7, with consolidation within a tight range before breaking down on increasing volume. This confirmed a bearish continuation pattern.
- Lower High Structure
The price has consistently formed lower highs—$1.91, $1.89, and now near $1.75—indicating persistent downward pressure.
- Bollinger Band Squeeze
A temporary contraction in the bands was followed by a sharp expansion to the downside, which is typically a volatility expansion signal in the trend’s direction.
- Double Bottom Potential
A possible double bottom is emerging around $1.73, a key support level. If this level holds and MACD begins to show bullish divergence, a short-term rebound may take place.
Indicators in Focus
- Bollinger Bands: Price currently trades near the lower band, suggesting oversold conditions.
- SMA20: Continues to act as resistance. A break above it could signal the start of a reversal.
- MACD: Still bearish on the 1H chart, but shorter timeframes (15min, 30min) may soon show divergence.
Support and Resistance Levels
- Major Resistance:
- $2.039 – Horizontal resistance from previous highs.
- $1.974 – Recent lower high and breakout failure.
- $1.852 – Middle BB/SMA20 level on the 1H chart.
- Major Support:
- $1.731 – Immediate and critical support.
- $1.60 – If $1.73 breaks, this is the next target.
- $1.50 – Strong psychological and technical support.
We are on twitter, follow us to connect with us :- @TimesTabloid1
— TimesTabloid (@TimesTabloid1) July 15, 2023
When to Expect a Rebound
A rebound could initiate if the $1.73 support holds, combined with:
- Bullish MACD divergence on 15–30min charts.
- Candle close above SMA20 on 30min/1H timeframe.
- Volume increase on green candles near $1.73.
- Short-term target on the rebound: $1.85–$1.90.
- Invalidation: A close below $1.73 with strong momentum may lead to $1.60 or lower.
XRP is currently in a bearish trend, but short-term indicators suggest a potential bounce if key support holds. Traders should watch the lower timeframes closely for confirmation signals while maintaining caution until the $1.85 resistance is reclaimed.
Disclaimer: This content is meant to inform and should not be considered financial advice. The views expressed in this article may include the author’s personal opinions and do not represent Times Tabloid’s opinion. Readers are urged to do in-depth research before making any investment decisions. Any action taken by the reader is strictly at their own risk. Times Tabloid is not responsible for any financial losses.
Follow us on X, Facebook, Telegram, and Google News