

 Price Action Breakdown: Key Levels Breached, Bearish Momentum Builds")
Overview
VeChain (VET) is currently trading at $0.02139, showing a 1.79% drop on the daily chart. The token continues its downward spiral as bearish momentum weighs heavily. Based on a detailed analysis of patterns, support/resistance levels, and key indicators, the outlook remains bearish unless reversal signals appear.
Support and Resistance Levels
- Major Support: $0.0203
- Key Resistance: $0.0242 and $0.0288
The price is sitting just above the $0.0203 support zone. If this level fails to hold, VET could dip toward the psychological $0.0180 mark. On the upside, the $0.0242 and $0.0288 levels act as resistance zones that need to be reclaimed for bullish momentum to return.
Chart Patterns
- Descending Triangle:
VET has formed a descending triangle pattern—a classic bearish continuation structure. This suggests a likely breakdown if support around $0.020 is breached.
- Falling Wedge:
There is also a visible falling wedge forming, typically a bullish reversal pattern. However, the breakout confirmation hasn’t occurred yet.
- Bear Flag:
Following a steep drop, VET has formed a bear flag. This continuation pattern indicates that the current sideways consolidation might resolve downward.
Technical Indicators
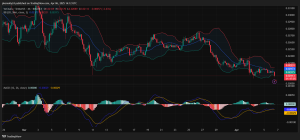
- Bollinger Bands (20, 2):
VET is hugging the lower band, reflecting oversold conditions and strong bearish pressure. The bands are also wide, signaling high volatility.
- MACD (12, 26):
The MACD remains below the signal line and in the negative zone. Momentum remains bearish, with no crossover in sight.
- EMA (20):
Price continues to trade below the 20-day EMA, reinforcing the downward trend. Until the price breaks and closes above this moving average, bulls will remain sidelined.
- RSI (14):
The RSI is in the oversold region, hovering around 30. While this suggests the potential for a bounce, historical behavior during strong downtrends shows RSI can stay oversold for extended periods.
We are on twitter, follow us to connect with us :- @TimesTabloid1
— TimesTabloid (@TimesTabloid1) July 15, 2023
Outlook and Next Price Target
Given the dominance of bearish patterns and the alignment of indicators, the near-term outlook for VET remains negative. If the $0.0203 support is lost, the next downside target lies near $0.0180. However, should the falling wedge break to the upside with increased volume, a relief rally toward $0.0242–$0.0250 could unfold.
Volume remains relatively low, signaling a lack of conviction from buyers. A meaningful reversal will likely need a surge in demand accompanied by bullish confirmation from MACD and RSI.
VeChain is at a critical juncture. Traders should monitor the $0.0203 support and watch for any signs of divergence in RSI or bullish MACD crossover. Until then, caution is warranted as the bears maintain control.
Disclaimer: This content is meant to inform and should not be considered financial advice. The views expressed in this article may include the author’s personal opinions and do not represent Times Tabloid’s opinion. Readers are urged to do in-depth research before making any investment decisions. Any action taken by the reader is strictly at their own risk. Times Tabloid is not responsible for any financial losses.
Follow us on X, Facebook, Telegram, and Google News