


Bitcoin (BTC) is in a clear corrective phase after peaking above $110,000. Recent price action reflects distribution, weakening momentum, and increasing downside risk. Over the past 10 weeks, bearish patterns and technical signals have emerged across key timeframes, suggesting caution is warranted in the near term.
Key Chart Patterns
- Triple Top (Weekly)
A distinct triple top near $109K signals strong resistance and bullish exhaustion. Failure to break above this level increases the probability of a deeper pullback.
- Bear Flag Breakdown (Daily/4H)
Price consolidated in a narrow channel before breaking down — a classic bear flag, indicating the continuation of the downtrend.
- Rounded Top Formation (10-Week Structure)
A gradual curve down from the recent high reflects waning momentum and potential for extended correction.
Technical Indicators
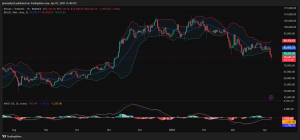
- Bollinger Bands (20 SMA)
BTC has broken below the mid-band on both weekly and daily charts, with expanding bands confirming rising volatility. On the 4H chart, the price tracks the lower band — a sign of persistent bearish pressure.
MACD (12, 26)
The MACD shows a confirmed bearish crossover on the weekly, with growing negative histogram bars. Daily and 4H MACD also align bearishly, indicating strong downward momentum.
- Exponential Moving Averages (EMA)
Price has slipped below the 20- and 50-EMAs on daily and 4H charts. The 200 EMA near $70,000 is a critical support level. A break below it could open the door to $65K or lower.
- RSI
The weekly RSI is trending downward toward 45, while the daily RSI sits near 40, showing bearish conditions but not yet oversold. On 4H, minor bullish divergence suggests potential for short-term relief.
- Volume
Volume has declined during the recent pullback, pointing to a lack of capitulation. A spike in volume near key supports would be required to signal a potential reversal.
We are on twitter, follow us to connect with us :- @TimesTabloid1
— TimesTabloid (@TimesTabloid1) July 15, 2023
Critical Levels
- Resistance: $82,000 / $92,800
- Immediate Support: $76,300
- Key Support: $70,000 (200 EMA) / $65,000
- Major Resistance: $98,000 / $109,000
Fundamental Check
Fundamentally, Bitcoin remains supported by long-term tailwinds — the upcoming halving, institutional adoption, and macro hedge appeal. However, short-term headwinds dominate: ETF outflows, declining spot demand, and risk-off sentiment due to persistent inflation and Fed hawkishness.
Recent miner sell-offs and profit-taking post-ATH have amplified selling pressure. Without a strong catalyst, upward momentum remains limited.
10-Week Price Projection
If BTC loses the $76K–$70K zone with volume confirmation, further downside to $65K is likely. A bounce toward $82K may occur, but sustained recovery depends on reclaiming the $92K–$98K area. Consolidation between $65K and $82K appears likely unless macro or fundamental catalysts shift sentiment decisively.
Disclaimer: This content is meant to inform and should not be considered financial advice. The views expressed in this article may include the author’s personal opinions and do not represent Times Tabloid’s opinion. Readers are urged to do in-depth research before making any investment decisions. Any action taken by the reader is strictly at their own risk. Times Tabloid is not responsible for any financial losses.
Follow us on X, Facebook, Telegram, and Google News