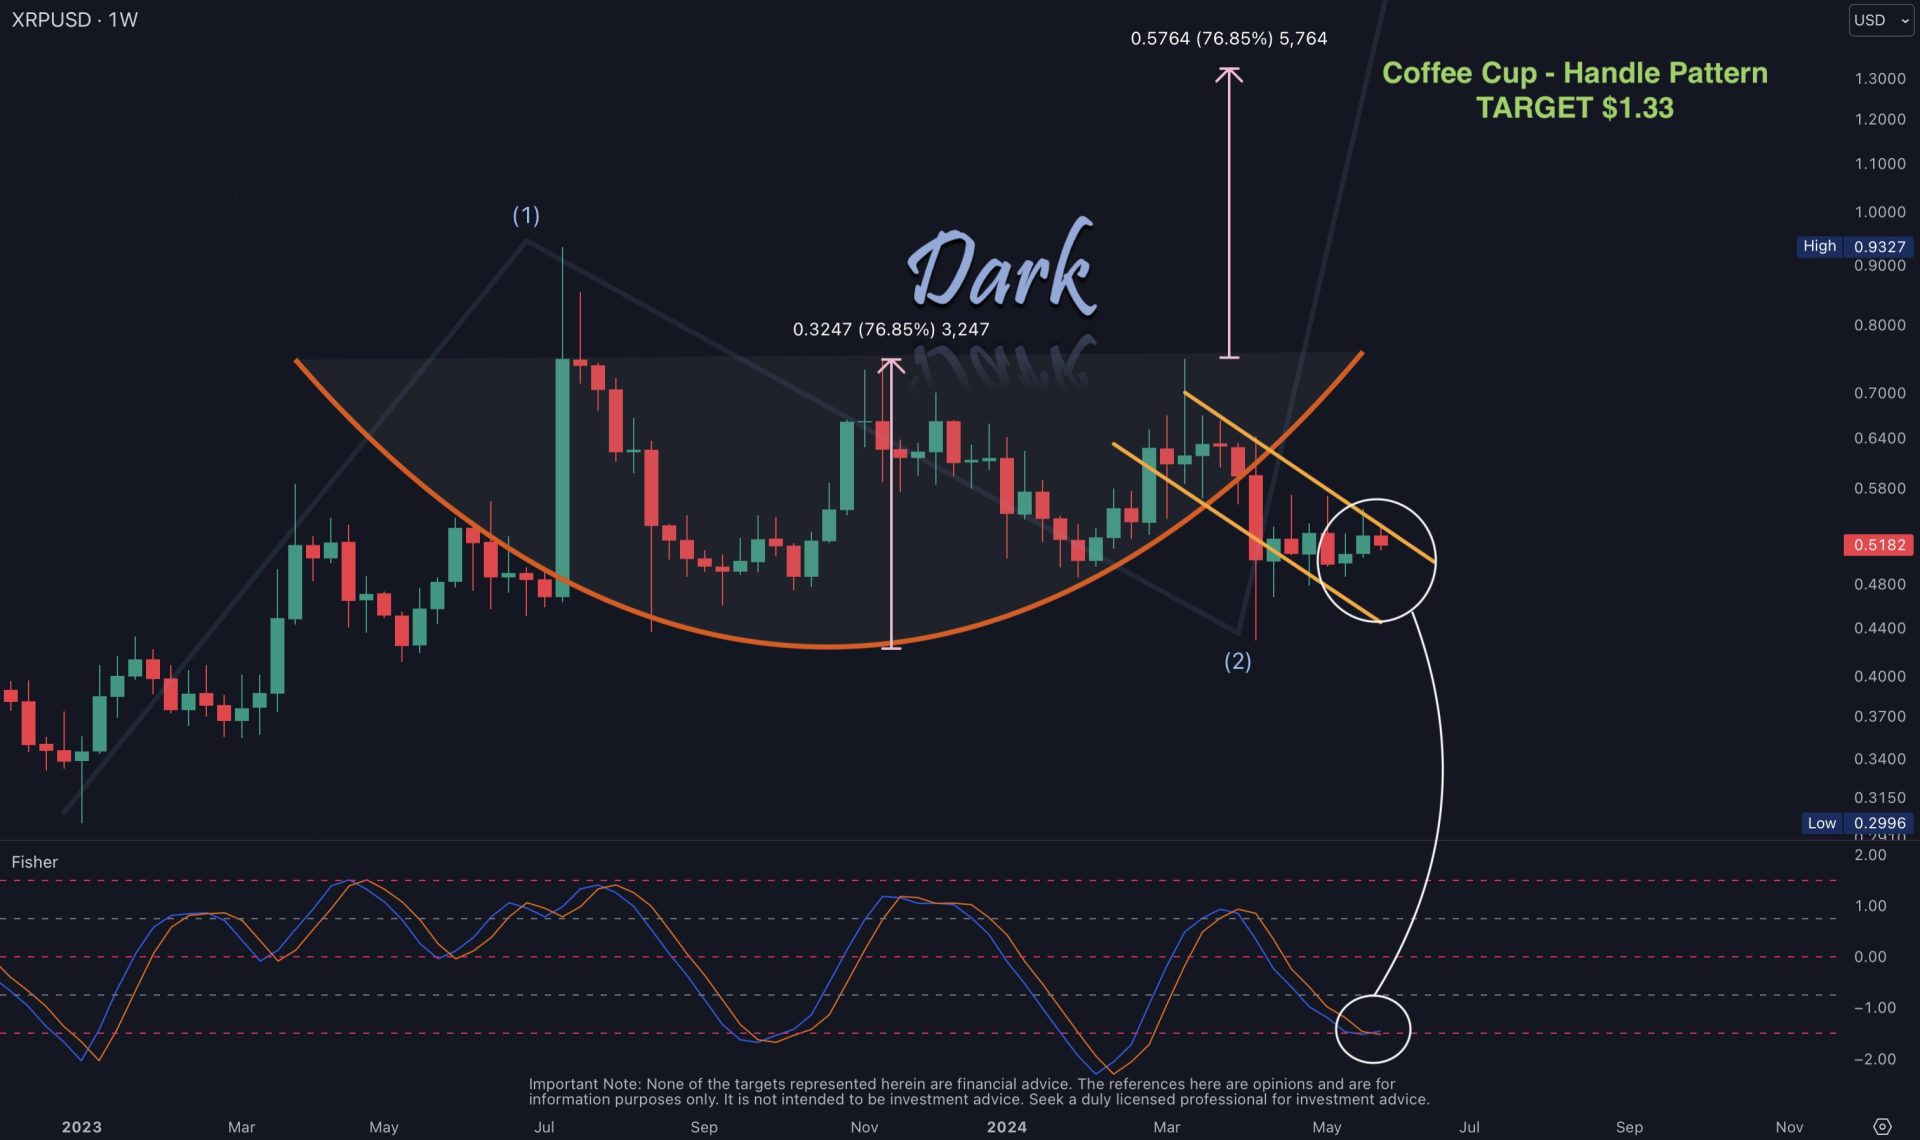
Technical indicators for XRP are suggesting a potential price surge soon. This confluence of bullish signals comes after the closing of the May candle, which Dark Defender (@DefendDark), a prominent crypto analyst, has shown to be within the framework of Elliott Wave Theory and chart patterns.

Read Also: XRP to $1.8? Multiple Technical Indicators Are Bullish
Elliott Wave Targets
Elliott Wave Theory is a technical analysis method that postulates that the price movement of an asset follows a specific five-wave pattern. Proponents of this theory use it to identify potential turning points in the market. According to analysts, XRP’s price action on the weekly chart appears to adhere to this Elliott Wave structure.
According to Dark Defender’s chart, XRP is currently in Wave 3, after exiting Wave 2 in late March.
The Cup and Handle Pattern
The analyst further highlights the formation of a bullish cup-and-handle pattern on the weekly XRP chart. This chart pattern is a well-recognized technical indicator that often precedes price breakouts. The cup portion of the pattern represents a period of consolidation, followed by a handle, which is a brief downward movement before the price breaks above the cup’s resistance level.
If the cup-and-handle pattern on XRP’s weekly chart is valid, a breakout above the resistance level could signify a significant price increase. The analyst has placed the target for this breakout at $1.33, representing a potential increase of 76.85% from XRP’s price at the time of his analysis. However, other prominent analysts have set targets as high as $50 based on a similar pattern.
Oversold Signal from Fisher Indicator
Adding to the bullish sentiment is the reading from the Fisher Indicator. This indicator is used to assess whether an asset is overbought or oversold. In Dark Defender’s analysis, the Fisher Indicator suggests that XRP is currently oversold. This could imply that the recent price decline has been excessive and a correction upwards is likely.
We are on twitter, follow us to connect with us :- @TimesTabloid1
— TimesTabloid (@TimesTabloid1) July 15, 2023
Read Also: As XRP Now In Oversold Area, Analyst States Next Resistance Level Before $1.05
XRP’s Future
The combination of Elliott Wave targets, the cup-and-handle pattern, and the oversold signal from the Fisher Indicator paints a potentially bullish picture for XRP. These indicators suggest that a price increase for XRP could be on the horizon, and many community members shared their optimism for XRP’s future.
A prominent analyst recently revealed that XRP is cooking up a historic move. The next few weeks and months could be life-changing for XRP holders as the digital asset attempts to make history.
Follow us on Twitter, Facebook, Telegram, and Google News


