


EGRAG CRYPTO (@egragcrypto), a well-known crypto analyst, recently shared a trading tip on X. This tip centers on the Relative Strength Index (RSI) and its potential use in identifying oversold conditions within the XRP market and could help XRP traders make millions.
What is the Relative Strength Index (RSI)?
The RSI is a technical analysis indicator employed by traders to assess the momentum of an asset’s price movement. It measures the magnitude of recent price changes to determine whether an asset is overbought (potentially primed for a price decline) or oversold (potentially primed for a price increase).
Read Also: XRP Hits Correction Target Zone, Analyst Foresees $3.47 Price. Here’s His Chart
The RSI is calculated using a formula that considers the average of a specific timeframe’s closing gains compared to the average of its closing losses. The resulting value is typically expressed on a scale of 0 to 100. Generally, an RSI value above 70 suggests an overbought condition, while a value below 30 suggests an oversold condition.
EGRAG CRYPTO’s Trading Tip
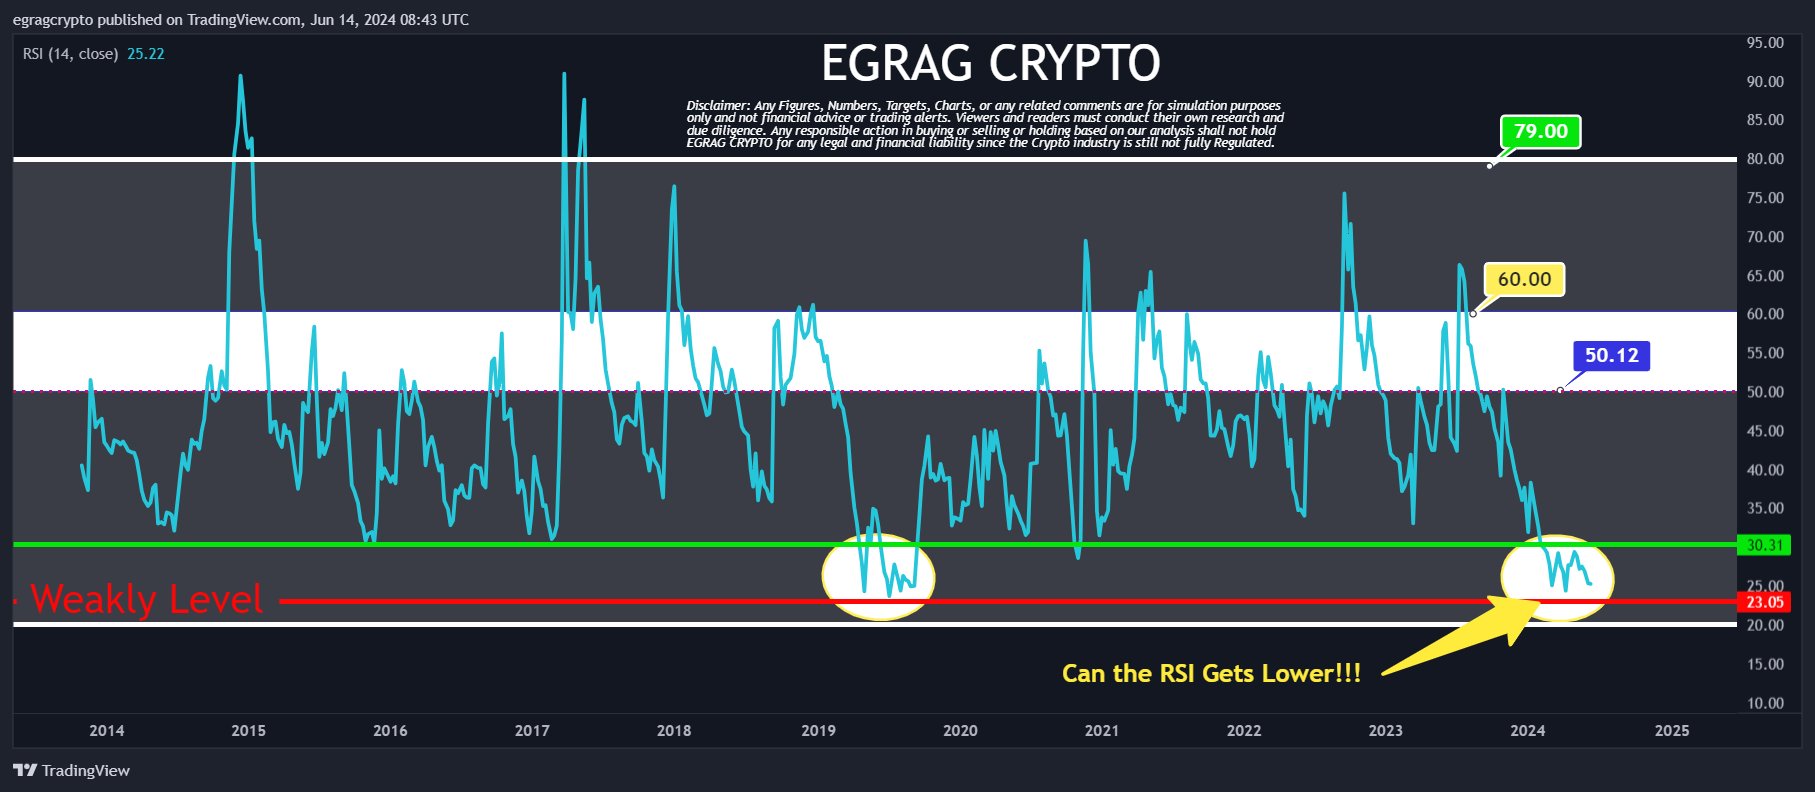
EGRAG CRYPTO’s tip highlights the potential significance of the RSI reaching its lowest point on the weekly timeframe. According to this view, a low RSI on the weekly chart could signal that XRP might be oversold, potentially presenting a buying opportunity for traders.
The underlying rationale behind this strategy is that when the RSI reaches its lowest point, it indicates a period of sustained selling pressure. This selling pressure may have driven the digital asset price below its true value.
As a result, some traders believe that such oversold conditions may be followed by a corrective price movement, where the price rebounds upwards. XRP recently reached its lowest RSI in history, suggesting it could be massively oversold.
We are on twitter, follow us to connect with us :- @TimesTabloid1
— TimesTabloid (@TimesTabloid1) July 15, 2023
Is the RSI a Guaranteed Indicator?
It is crucial to understand that the RSI is not a foolproof indicator, and relying solely on it for trading decisions can be risky. The following are important points to consider:
Market Context Matters: The interpretation of an RSI reading can vary depending on the broader market context. For instance, a low RSI during a strong downtrend might not necessarily signal an imminent price reversal.
Read Also: Analyst Spots XRP Cup-Handle Pattern On Weekly Chart, Sets Bullish Target
Other Indicators: Many traders utilize the RSI and other technical indicators to understand the market better. This technique can help to confirm or refute signals generated by the RSI.
Price History: Analyzing historical price movements alongside the RSI can provide valuable insights. Observing how the price has reacted to previous oversold readings on the RSI can inform trading decisions.
Despite the excitement caused by the oversold RSI, a prominent figure recently predicted that something crucial needs to happen for XRP’s price to increase.
Disclaimer: This content is informational and should not be considered financial advice. The views expressed in this article may include the author’s personal opinions and do not represent Times Tabloid’s opinion. Readers are urged to do in-depth research before making any investment decisions. Times Tabloid is not responsible for any financial losses.
Follow us on Twitter, Facebook, Telegram, and Google News