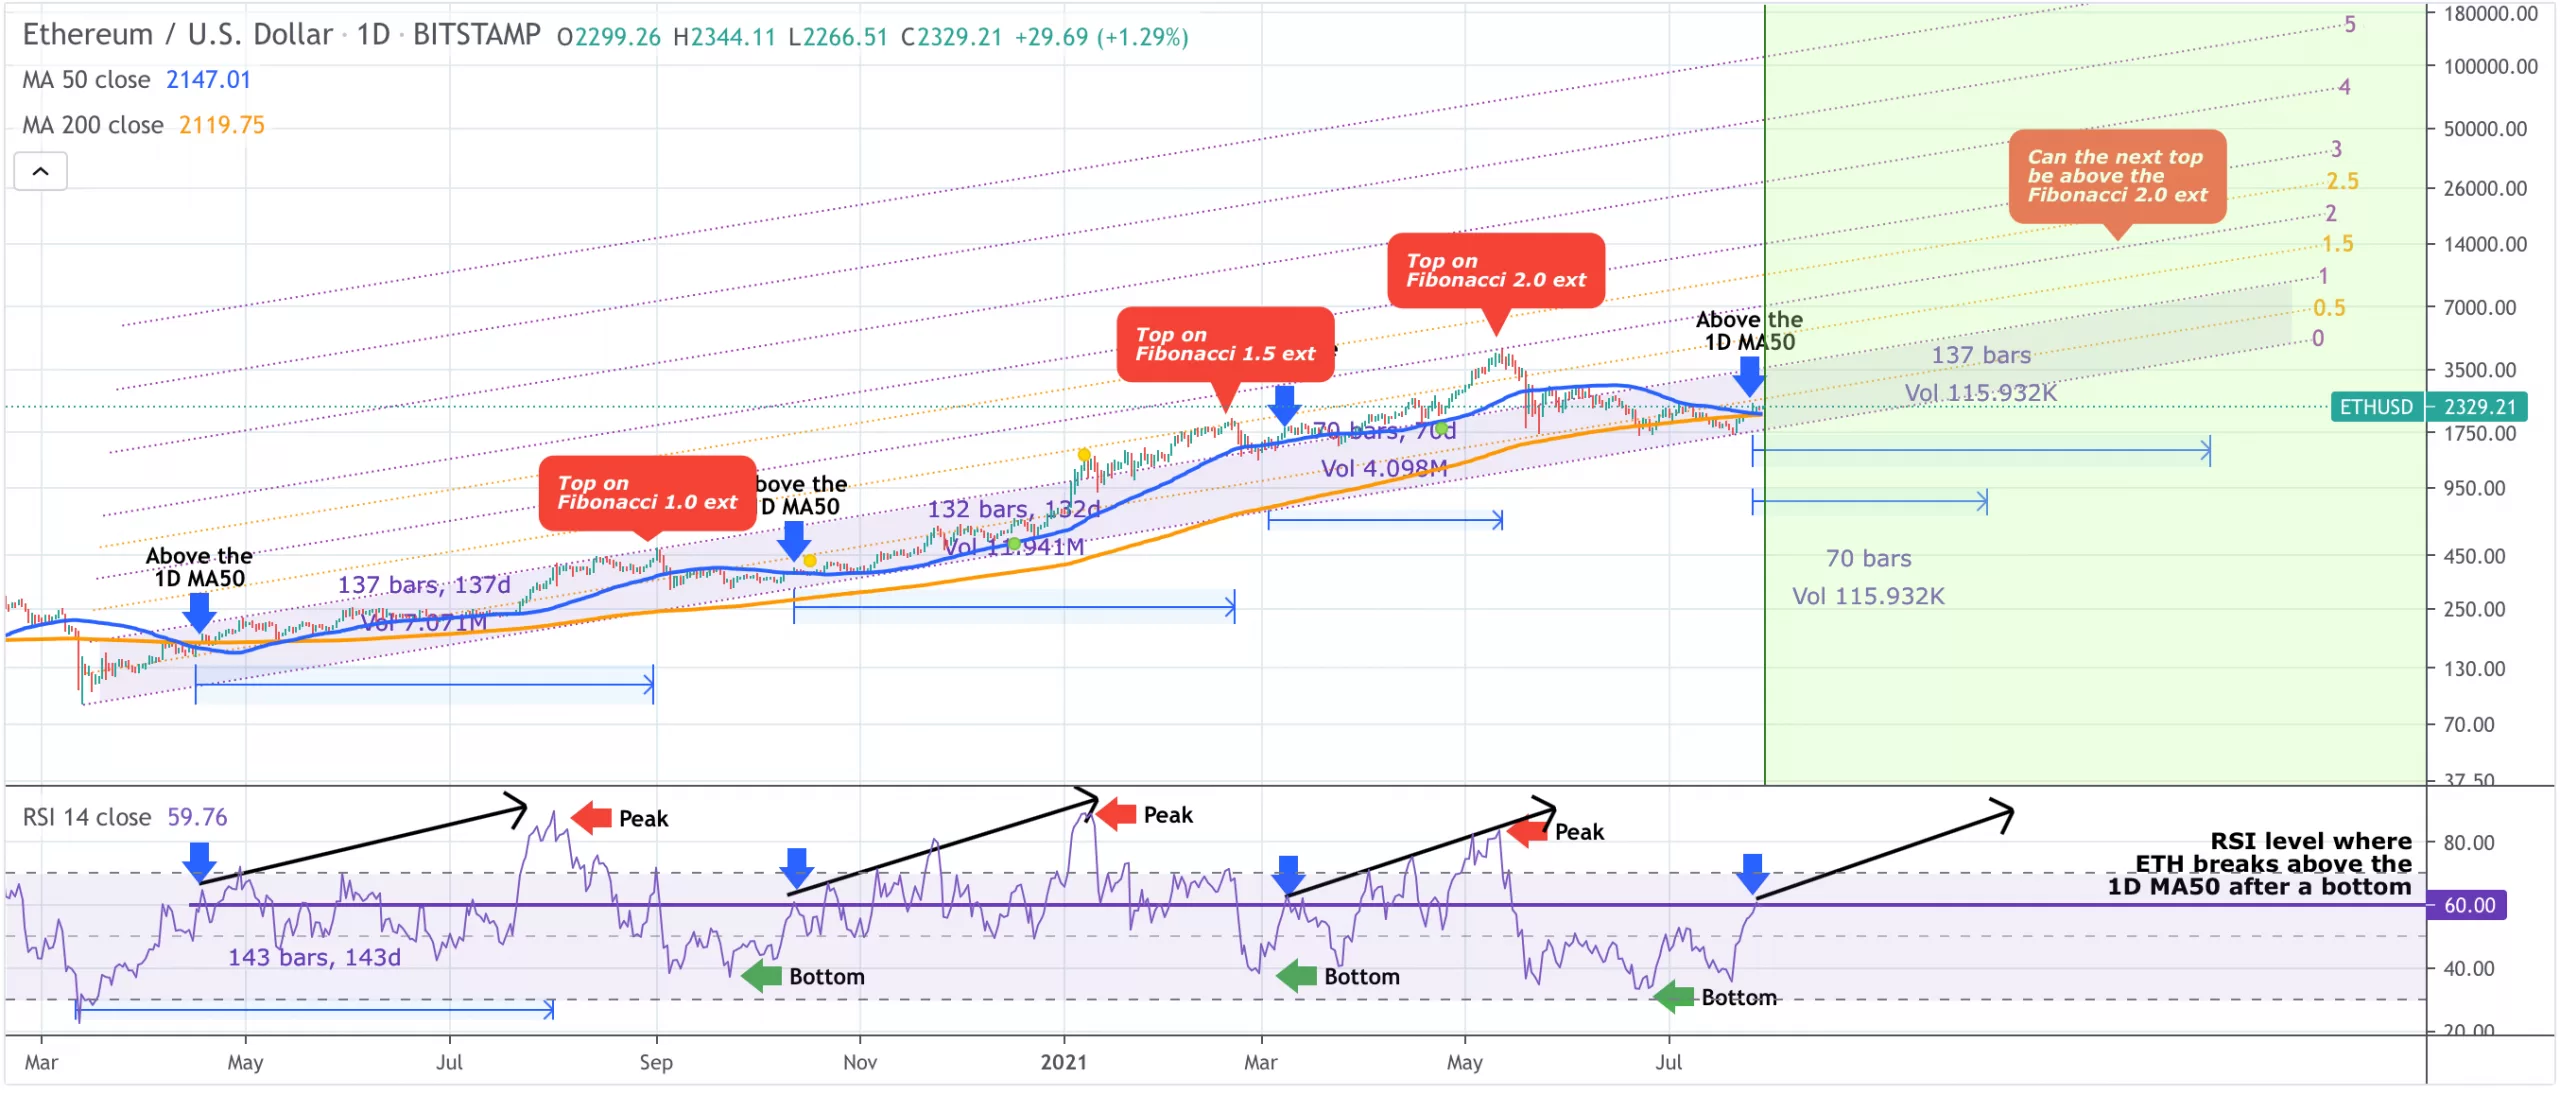
Ethereum (ETH), the second-largest cryptocurrency by market capitalization, is poised to end up at a price above $14,000 in 2021, if the March 2020 fractal remains intact.
This likely trend was first noticed by a crypto enthusiast, TradingShot, and reported by Cointelegraph. According to the report, the Ethereum fractal involves three technical indicators, namely;
- 50-day simple moving average (50-day SMA)
- Fibonacci channel
- Relative strength index (RSI).
Read Also: Here’s What Is Next for Ethereum (ETH) and VeChain (VET) As Mapped out by Crypto Michael

In July 2021, Ethereum (ETH) closed above its 50-day Simple Moving Average (SMA), which was the first time since the May 2021 bearish correction.
According to TradingShot, a break above the moving average wave in question historically predicts bullish trends. For example, a surge above the 50-day SMA in April 2020 took the Ethereum (ETH) against USD (ETH/USD) exchange rate from relatively $170 to above $500 in September 2020, which took just 137 days.
Ethereum’s daily RSI shot higher from neutral to overbought at the period of the notable gains. And as the digital currency kept surging, its price trends found interim support and resistance levels inside a Fibonacci channel.
According to TradingShot, there were several instances based on the April-September 2020 fractal, whereby ETH closed above its 50-day SMA and rallied higher inside the Fibonacci channel. The analyst says the same has started happening in July 2021.
TradingShot noted:
“Once [the 50-day SMA] breaks, it takes ETH either 132, 137 or 70 days to reach its next top on the Fibonacci scale. As you see, tops are progressive one level higher each time—first 1.0, then 1.5, and the most recent in May on 2.0 Fib).”
Next Leg Upward For Ethereum (ETH) Could Be $4,000
According to the analyst, the 1.0 level on the next leg upward could make the price of Ethereum (ETH) hit $4,000. While an extended uptrend could push its price to 1.5 and 2.0 Fibonacci levels, which imply relatively $6,000 and $9,000 respectively.
Read Also: Real Vision’s Raoul Pal: Clearest Bet in the Crypto Space Right Now Is on Ethereum (ETH)
However, TradingShot pointed out that on each rally, after closing above the 50-day SMA, the ETH uptrend progresses one level higher on the Fibonacci scale. So, this would make the digital currency make 2.5 Fibonacci level its next target, which implies a price trend above $14,000.
TradingShot noted:
“Technically, we may assume that the next Top will be at 2.5 or higher but certainly that appears to be a very high level from the current prices especially if it technically “needs” to be achieved in 137 days (or even worse 70 days) as the model suggests.”
Follow us on Twitter, Facebook, Telegram, and Download Our Android App


