


Alex Cobb, a prominent crypto analyst, recently highlighted a technical analysis chart suggesting a potential bullish breakout for XRP.
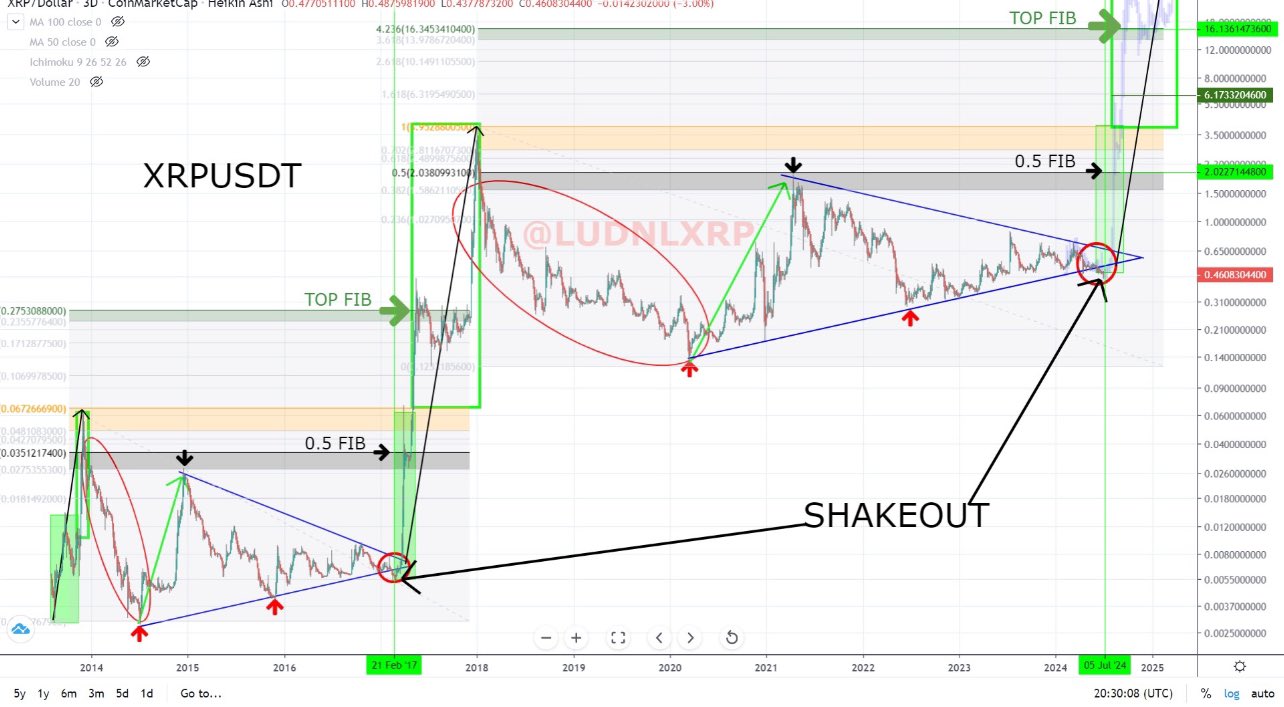
The chart, created by @ludnlxrp, utilizes various technical indicators to forecast XRP’s future price movements. The chart analyzes XRP’s price action over a decade (2014-2024).
Key features include:
Fibonacci Retracement Levels: These levels pinpoint potential support and resistance areas. The 0.5 level (50%) has significantly impacted XRP’s price throughout history.
Symmetrical Triangles: These blue triangles indicate consolidation periods, often followed by significant price movements (up or down). The chart highlights two triangles with the first (2014-2017) leading to a substantial breakout aligning with the top Fibonacci level and the second (2018-present) suggesting a similar potential breakout.
Shakeout Phase: Also seen in the chart is a “Shakeout” phase. This refers to a temporary price dip that eliminates weak investors before a potential surge. The chart marks a “Shakeout” phase converging with the current triangle’s apex.
Historical Price Patterns: Green and red arrows highlight past turning points, suggesting similar patterns might repeat. Green rectangles indicate price increases following symmetrical triangles.
Read Also: Analyst: XRP and Stellar (XLM) Will Melt Faces Very Soon
Future Price Projections:
The analysis suggests that XRP is poised for a bullish breakout. The price converges with the triangle’s peak and the recent dip (shakeout) mirrors a pattern seen in 2017 before a significant price surge. The top Fibonacci level (around $15-$16) aligns with a projected price increase, potentially mirroring XRP’s price path observed between 2014-2017.
The technical analysis by @ludnlxrp presents a promising outlook for XRP. While compelling, these projections aren’t guaranteed. Investors should conduct their research before making investment decisions.
We are on twitter, follow us to connect with us :- @TimesTabloid1
— TimesTabloid (@TimesTabloid1) July 15, 2023
Cobb’s enthusiasm is echoed by many analysts in the crypto space, where technical analysis remains a dominant force for predicting price movements. Egrag Crypto, in a separate analysis, identified a symmetrical triangle pattern forming on XRP’s weekly chart.
Read Also: Based On 3 XRP Trend Triangles, Bullish Chartist Predicts Minimum Target Of $33. Here’s the Timeline
The analyst believes the triangle on XRP’s weekly chart, looks a lot like the one that came before it hit its record price of $3.84 in January 2018. His analysis suggests XRP might hit the $27 price point.
However, it’s crucial to remember that the broader market sentiment and unforeseen events can significantly impact XRP’s price. As the cryptocurrency market continues to evolve, XRP’s price action will be fascinating to watch in the coming months.
Disclaimer: This content is meant to inform and should not be considered financial advice. The views expressed in this article may include the author’s personal opinions and do not represent Times Tabloid’s opinion. Readers are urged to do in-depth research before making any investment decisions. Times Tabloid is not responsible for any financial losses.
Follow us on Twitter, Facebook, Telegram, and Google News