


The XRP weekly chart reveals a high-stakes consolidation zone following a historic rally. As the market digests this powerful uptrend, price action is forming potential reversal or continuation patterns. Here’s a breakdown of XRP’s current technical setup and what could lie ahead.
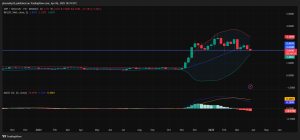
Chart Patterns: Formation Signals at a Turning Point
- Rising Wedge Formation: The current weekly candles show narrowing price action after the strong bullish run from below $0.50 to over $3.00. This rising wedge pattern is generally a bearish reversal signal, indicating slowing momentum and a potential downside move unless buyers defend key support levels aggressively.
- Double Top Possibility: XRP faced rejection near $2.60 twice, suggesting a possible double top. If confirmed with a close below the neckline around $2.03, it could trigger a deeper retracement toward the $1.69–$1.40 zone.
- Bullish Flag (Still Valid): Despite current weakness, the sharp rally followed by tight consolidation resembles a bull flag, which could indicate continuation to the upside if buyers reclaim $2.60 convincingly.
Key Indicators Analysis
- Bollinger Bands (BB):
XRP is currently trading just above the midline of the Bollinger Bands, around $2.03.
Volatility has slightly contracted, showing a pause in price expansion. A breakout above the upper band near $2.59 or a breakdown below $2.03 will determine the next major move.
Support zone at the lower BB (around $1.07) remains the critical defense area.
- MACD (Moving Average Convergence Divergence):
The MACD line is above the signal line, but histogram bars are shrinking—indicating weakening bullish momentum.
A bearish crossover could form in the coming weeks if momentum does not pick up, supporting short-term correction fears.
- EMA (Exponential Moving Average):
XRP is comfortably trading above the 20-week EMA, currently near $2.03. This level is acting as dynamic support.
The slope remains upward, a sign of broader trend strength, but the recent candle closes below the $2.09 zone suggest testing this level.
- RSI (Relative Strength Index):
RSI remains elevated but has slipped from extreme overbought territory.
The indicator suggests that while bullish strength is still present, the asset is cooling off and may correct further before any renewed rally.
We are on twitter, follow us to connect with us :- @TimesTabloid1
— TimesTabloid (@TimesTabloid1) July 15, 2023
Support and Resistance Levels
- Key Support: $2.03, followed by $1.69 and $1.07 (Bollinger lower band & previous breakout zone).
- Immediate Resistance: $2.59, which must be broken to resume the uptrend.
Major Resistance: $3.00 psychological level, followed by the local high around $3.30.
Forecast and Next Price Target
The weekly chart shows XRP at a decisive level. If it holds the $2.03 support and bullish volume returns, a breakout above $2.59 could lead to a retest of $3.00–$3.30. However, failure to hold $2.03 could see the price dip toward the $1.70–$1.40 range for a healthier retracement before the next rally phase.
Overall, XRP’s trend remains bullish in the macro view, but short-term caution is advised due to consolidating indicators and evolving chart patterns.
Disclaimer: This content is meant to inform and should not be considered financial advice. The views expressed in this article may include the author’s personal opinions and do not represent Times Tabloid’s opinion. Readers are urged to do in-depth research before making any investment decisions. Any action taken by the reader is strictly at their own risk. Times Tabloid is not responsible for any financial losses.
Follow us on X, Facebook, Telegram, and Google News