


XRP trades at $2.18, up 1.67% in 24 hours. Market sentiment is mixed, with price action hinging on key technical levels.
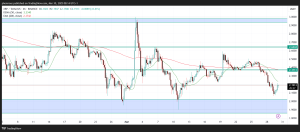
Daily Chart Outlook
XRP remains in a descending channel, signaling bearish momentum. The 100-day Exponential Moving Average (EMA) acts as resistance. A breakout above could shift momentum, while rejection may trigger further declines.
4-Hour Chart Trends
On the 4-hour timeframe, XRP moves within an ascending channel, forming higher highs and lows. A strong support zone near the 0.618–0.65 Fibonacci retracement range could fuel a rally toward $2.80–$2.90 if buying pressure continues.
1-Hour Chart Signals
XRP recently faced rejection at $2.19–$2.20, reflecting strong resistance. The Moving Average Convergence Divergence (MACD) suggests overbought conditions, and Bollinger Bands indicate potential retracement if the price dips below $2.15.
Key Support and Resistance Levels
- Resistance: $2.19–$2.20, $2.37–$2.42
- Support: $2.15, $2.00
These levels will dictate near-term price direction.
We are on twitter, follow us to connect with us :- @TimesTabloid1
— TimesTabloid (@TimesTabloid1) July 15, 2023
Market Projection for Today
XRP may consolidate between $2.15 and $2.20. A break above $2.20 could push prices toward $2.37, while failure to hold $2.15 may lead to a retest of $2.00.
XRP’s trajectory depends on breaking resistance levels. While short-term bullish patterns exist, sustained growth requires overcoming technical barriers. Traders should remain cautious and adapt to evolving market conditions.
Disclaimer: This content is meant to inform and should not be considered financial advice. The views expressed in this article may include the author’s personal opinions and do not represent Times Tabloid’s opinion. Readers are urged to do in-depth research before making any investment decisions. Any action taken by the reader is strictly at their own risk. Times Tabloid is not responsible for any financial losses.
Follow us on X, Facebook, Telegram, and Google News