Recently, the appearance of a golden cross on the XRP price chart has stirred up excitement among crypto users. But what is a golden cross, and does it indicate a bullish trend for XRP?
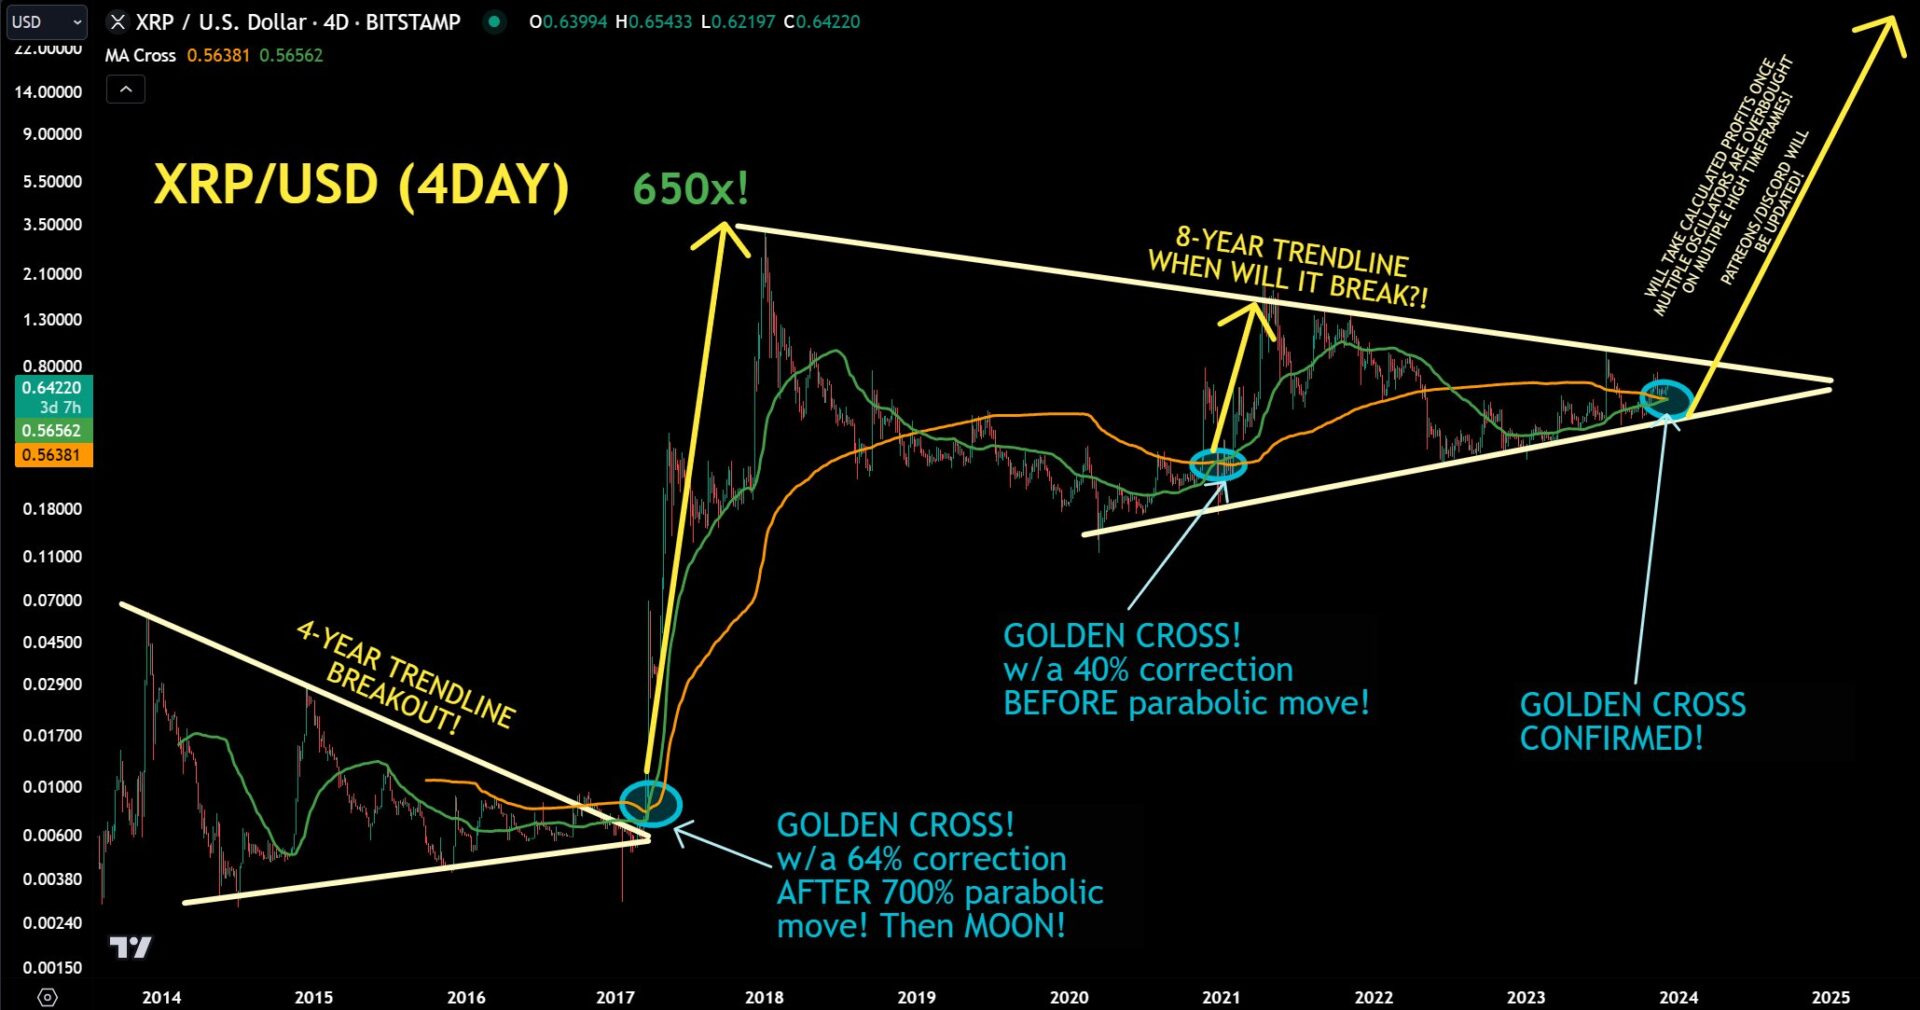
Speaking on X, prominent crypto analyst JD (@jaydee_757) said, “XRP Golden Cross confirmed on 4 day chart! XRP did the following after cross: 2017 – 700% first w/a 64% correction right b/4 MOON! 2020 – 40% first, then 1000% after! Either way, 5% (smart money) took calculated profits while 95% STILL got REKT!”

JD also showcased a four-day XRP chart illustrating the price fluctuations of digital assets since 2014. Notably, information from the chart validates that XRP consistently adheres to a breakout pattern when its shorter moving average (MA) surpasses the longer moving average.
Read Also: Google Bard Predicts XRP Price If Bitcoin Hits $530,000 As Projected by Bloomberg
When a short-term moving average, such as the 50-day moving average, crosses over a long-term moving average, like the 200-day moving average, it is known as the “Golden Cross” in technical analysis. Traditionally, this pattern has been read as a possible upward trend trigger, indicating a change from temporary strength to long-term momentum.
XRP Golden Cross History
According to JD’s chart, the first cross emerged on the XRP chart in November 2017 using a 4-day timeframe. XRP had a 700% increase in value just after the cross, followed by a 64% correction.
This setback was just temporary, as the bulls quickly rallied. The chart data demonstrates how XRP eventually surged even higher, reaching an unprecedented peak of $3.31 in January 2018, an astounding 650x gain.
In late 2020, XRP saw the Golden Cross for the second time, which sparked a price surge. This time, a 40% correction followed the crossover. But this correction also brought a remarkable price surge, which in April 2021 saw a 1,000% increase to $1.9669.
We are on twitter, follow us to connect with us :- @TimesTabloid1
— TimesTabloid (@TimesTabloid1) July 15, 2023
Read Also: Expert Proves XRP Price Suppression with Ripple’s XRP Monthly Sale
Recently, XRP recorded another golden cross, more than two years after the first crossover. According to JD, the charts validate the current cross, and bulls are waiting for sufficient momentum to push for another breakthrough. Although he did not disclose a precise price target, his chart indicates that there may be a rally above the $14 price barrier.
While the recent Golden Cross shares similarities with previous occurrences in 2017 and 2020, followed by significant price rallies, it is important to note key differences.
The Golden Cross coincided with broader market bullishness and positive developments surrounding the Ripple legal tussle with the SEC. In contrast, the current market environment remains uncertain.
However, Cardano also formed a golden cross recently, and more cryptocurrencies are surging. So, this could be a sign of a bullish future for the market.
Follow us on Twitter, Facebook, Telegram, and Google News.


