


Over the past 100 days, XRP has struggled to maintain bullish momentum, and recent price action across the daily, 4H, and 15M timeframes suggests further downside could be imminent unless a strong reversal forms. The charts reveal several bearish technical patterns, reinforced by momentum indicators and weakening fundamentals.
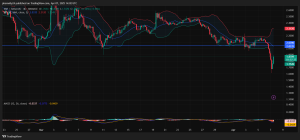
Chart Patterns
- Double Top (Daily):
A classic double top formed between late February and mid-March near the $2.80 mark. The neckline at $2.03 has now been decisively broken, confirming a major bearish reversal and opening downside potential toward $1.60 and $1.35.
- Descending Triangle (4H):
A descending triangle formed through March with repeated lower highs and stable support at $2.03. The recent breakdown signals intensified selling pressure, with bears in control.
- Bearish Flag (15M):
On lower timeframes, XRP printed a bear flag during brief consolidations, which broke down sharply—indicating a continuation of the downtrend.
- Broadening Wedge (4H):
A volatile broadening wedge emerged in early April, with a breakdown accelerating the move to new local lows.
Indicators Analysis
- Bollinger Bands (Daily & 4H):
Price is hugging the lower band, signaling persistent selling. The squeeze in earlier weeks gave way to an expansion, which confirmed volatility returning—with a bearish follow-through.
- MACD (All Timeframes):
MACD shows clear bearish crossovers on the daily and 4H, with widening histogram bars. The 15M chart shows a slight bullish divergence, suggesting a brief relief bounce may be near, but the broader trend remains negative.
- EMA (20/50/100):
XRP trades below the 20, 50, and 100 EMA across all timeframes, with the 20 EMA acting as dynamic resistance. The 100-day EMA on the daily sits near $2.22—now a major resistance zone.
- RSI:
Daily RSI is near 30, reflecting oversold conditions but no reversal yet. The 4H RSI confirms bearish momentum, while the 15M RSI dips below 25, hinting at a possible short-term bounce.
Key Support & Resistance
- Major Resistance: $2.03, $2.22
- Immediate Support: $1.70, $1.60
- Next Major Support: $1.35
Fundamental Outlook
XRP continues to face regulatory overhang from the SEC case, muting investor enthusiasm despite broader market recovery attempts. Utility adoption for the XRP Ledger is progressing, but market sentiment remains reactive to legal updates and macroeconomic factors like Fed policy and crypto ETF flows.
We are on twitter, follow us to connect with us :- @TimesTabloid1
— TimesTabloid (@TimesTabloid1) July 15, 2023
Ripple’s expansion in APAC and ODL (On-Demand Liquidity) corridors adds long-term value, but the near-term price is more influenced by speculative flows and sentiment, both of which currently favor risk-off.
Next 100 Days: Bearish Tilt Unless Key Levels Reclaimed
If XRP fails to reclaim $2.03 on strong volume, further declines to $1.60 and potentially $1.35 are likely. Only a break above the $2.22–$2.30 zone, alongside MACD and RSI reversals, could shift sentiment.
Expect continued downside pressure in the coming weeks, with possible consolidation between $1.60–$1.83 before the next directional move. Traders should watch for volume spikes and divergence signals for early trend reversal cues.
Disclaimer: This content is meant to inform and should not be considered financial advice. The views expressed in this article may include the author’s personal opinions and do not represent Times Tabloid’s opinion. Readers are urged to do in-depth research before making any investment decisions. Any action taken by the reader is strictly at their own risk. Times Tabloid is not responsible for any financial losses.
Follow us on X, Facebook, Telegram, and Google News