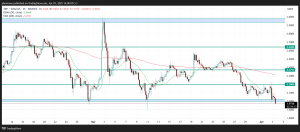
XRP is priced at $2.02, showing a 4.27% decline from the previous close. This analysis explores XRP’s price action on the weekly, daily, and 4-hour charts, offering insights into its potential future movements and what traders should expect in the next session.

Weekly Chart Overview
The weekly chart reveals that XRP is currently testing a critical support zone around $2.00. This level has historically acted as a strong buying point, providing a solid foundation for XRP’s price action. As long as the price remains above $2.00, there is potential for a rebound and a continuation of the uptrend. Traders should pay close attention to this key level, as a break below $2.00 could trigger further selling pressure and a retest of lower levels.
Daily Chart Analysis
On the daily timeframe, XRP appears to be forming a head-and-shoulders pattern, a bearish reversal formation. The neckline of this pattern sits at around $2.00. If the price breaks below this level, it could signal a potential downtrend, with a price target of approximately $1.23, marking a 38% correction from the current price. This bearish outlook highlights the importance of the $2.00 level as a pivotal point. A break below this support would open the door for further downside, while a bounce from this level could maintain bullish momentum.
4-Hour Chart Breakdown
The 4-hour chart indicates a consolidation phase between the $2.11 and $2.60 levels. The $2.40 mark is a crucial resistance point, and if XRP manages to break above this zone, a rally toward higher resistance levels could be expected. However, the price is currently trading closer to the $2.11 support, and a break below this level could lead to a bearish shift, potentially testing lower supports.
We are on twitter, follow us to connect with us :- @TimesTabloid1
— TimesTabloid (@TimesTabloid1) July 15, 2023
Immediate Price Action and What to Expect Next
Looking at the immediate outlook, XRP faces a critical juncture. The price is hovering around the $2.00 support level, and its next move will depend on whether this level holds or breaks. If XRP manages to hold above $2.00, a short-term rally toward the $2.40 resistance could occur. However, if the price fails to hold the $2.00 level, the bearish head-and-shoulders pattern could play out, potentially pushing XRP lower, with the next target around $1.23.
The immediate price action for XRP hinges on the $2.00 support level. Traders should be cautious and closely monitor this area, as it will determine whether XRP continues its bullish momentum or experiences a downside correction. With significant volatility in the crypto market, risk management is essential for navigating these uncertain price movements.
Disclaimer: This content is meant to inform and should not be considered financial advice. The views expressed in this article may include the author’s personal opinions and do not represent Times Tabloid’s opinion. Readers are urged to do in-depth research before making any investment decisions. Any action taken by the reader is strictly at their own risk. Times Tabloid is not responsible for any financial losses.
Follow us on X, Facebook, Telegram, and Google News


