


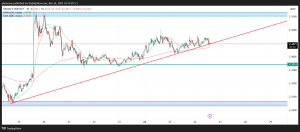
XRP is trading at $2.45, up 0.82%, signaling steady bullish momentum. A deep dive into the 15-minute, 30-minute, and 1-hour charts confirms this trend, suggesting further gains in the next six hours.
Technical Analysis
15-Minute Chart: Strong Bullish Bias
With 92.86% bullish signals from moving averages, buyers dominate this timeframe. Higher highs and lows indicate continued strength, with $2.48-$2.50 emerging as the next target.
30-Minute Chart: Uptrend Intact
The 30-minute chart reflects sustained bullish momentum. As long as XRP holds above $2.43, upward pressure remains, setting the stage for a potential breakout.
1-Hour Chart: Confirmation of Strength
With 75% bullish moving averages, XRP’s uptrend is well-supported. The key $2.50 resistance is critical—breaking it could open the door for $2.55-$2.60.
Next 6-Hour Projection
- Bullish Scenario: A breakout above $2.50 may push XRP toward $2.55-$2.60.
- Support Levels: $2.42-$2.43 remains the key demand zone.
- Pullback Risk: Failure at $2.50 could trigger a dip to $2.40, but buyers are likely to defend this level.
We are on twitter, follow us to connect with us :- @TimesTabloid1
— TimesTabloid (@TimesTabloid1) July 15, 2023
XRP’s bullish trend remains strong, with key resistance at $2.50. A breakout could fuel further gains, while rejection may lead to a brief retracement before another rally. Stay alert for volatility and trade accordingly.
Disclaimer: This content is meant to inform and should not be considered financial advice. The views expressed in this article may include the author’s personal opinions and do not represent Times Tabloid’s opinion. Readers are urged to do in-depth research before making any investment decisions. Any action taken by the reader is strictly at their own risk. Times Tabloid is not responsible for any financial losses.
Follow us on X, Facebook, Telegram, and Google News