


XRP’s monthly chart signals a critical juncture. After a sharp rally that pushed the asset to a multi-year high near $3.80, price action has since shifted into correction mode. The last three monthly candles have all closed bearish, reflecting consistent selling pressure and a potential trend reversal in motion. As April unfolds, XRP is testing a crucial support zone around $2.00, making this month pivotal.
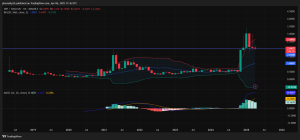
Chart Patterns and Structure
A clear “Three Black Crows” pattern has emerged—three consecutive red candles with lower closes and minimal wicks. This structure is often seen at the top of bullish cycles, suggesting weakening momentum and a possible long-term downtrend if not invalidated. XRP now sits just above the former resistance zone at $2.00, which has turned into support. Holding this level is essential to prevent further downside.
Bollinger Bands (BB)
The Bollinger Bands remain wide, confirming heightened volatility. Price is currently testing the middle band (20-period SMA), a dynamic level that often acts as support in trending markets. A close below this line could open the door to the lower band region near $1.60. On the upside, reclaiming the $2.40–$2.60 area would strengthen bullish sentiment and revive chances of a move back toward $3.00.
MACD (Moving Average Convergence Divergence)
The MACD is still above the zero line, indicating a technically bullish market. However, the histogram has declined for three consecutive months, and the MACD line is nearing a bearish crossover with the signal line. If confirmed, this would signal a shift toward bearish momentum, with implications for medium-term price weakness.
RSI (Relative Strength Index)
The monthly RSI has dropped from overbought territory and now hovers around 70. Although still in bullish territory, the downward slope shows increasing selling strength. A break below 70 could indicate deeper correction ahead, likely leading to a move toward the neutral 50 mark.
Volume
Volume has steadily decreased since the peak, aligning with the price decline. This fading participation suggests weakening buyer interest, reducing the likelihood of a strong bounce unless new demand emerges.
We are on twitter, follow us to connect with us :- @TimesTabloid1
— TimesTabloid (@TimesTabloid1) July 15, 2023
April 2025 Outlook and Price Projection
April will be a decisive month for XRP. If bulls can maintain support above $2.00, a bounce toward $2.40–$2.60 is possible. Reclaiming that zone would set the stage for renewed bullish momentum. However, a breakdown below $2.00 would likely drag XRP toward $1.80 or even $1.60, where stronger support lies.
XRP is teetering at a key inflection point. The current technical setup favors cautious optimism if $2.00 holds. However, the weakening indicators and bearish pattern formation suggest traders should be prepared for continued consolidation or further correction if momentum fails to return.
Disclaimer: This content is meant to inform and should not be considered financial advice. The views expressed in this article may include the author’s personal opinions and do not represent Times Tabloid’s opinion. Readers are urged to do in-depth research before making any investment decisions. Any action taken by the reader is strictly at their own risk. Times Tabloid is not responsible for any financial losses.
Follow us on X, Facebook, Telegram, and Google News