XRP could be on the cusp of a significant rally as two well-respected analysts have independently identified a golden cross pattern in the XRP price chart. A golden cross occurs when a shorter-term moving average intersects and surpasses a longer-term moving average, often signaling a potential bullish trend reversal.
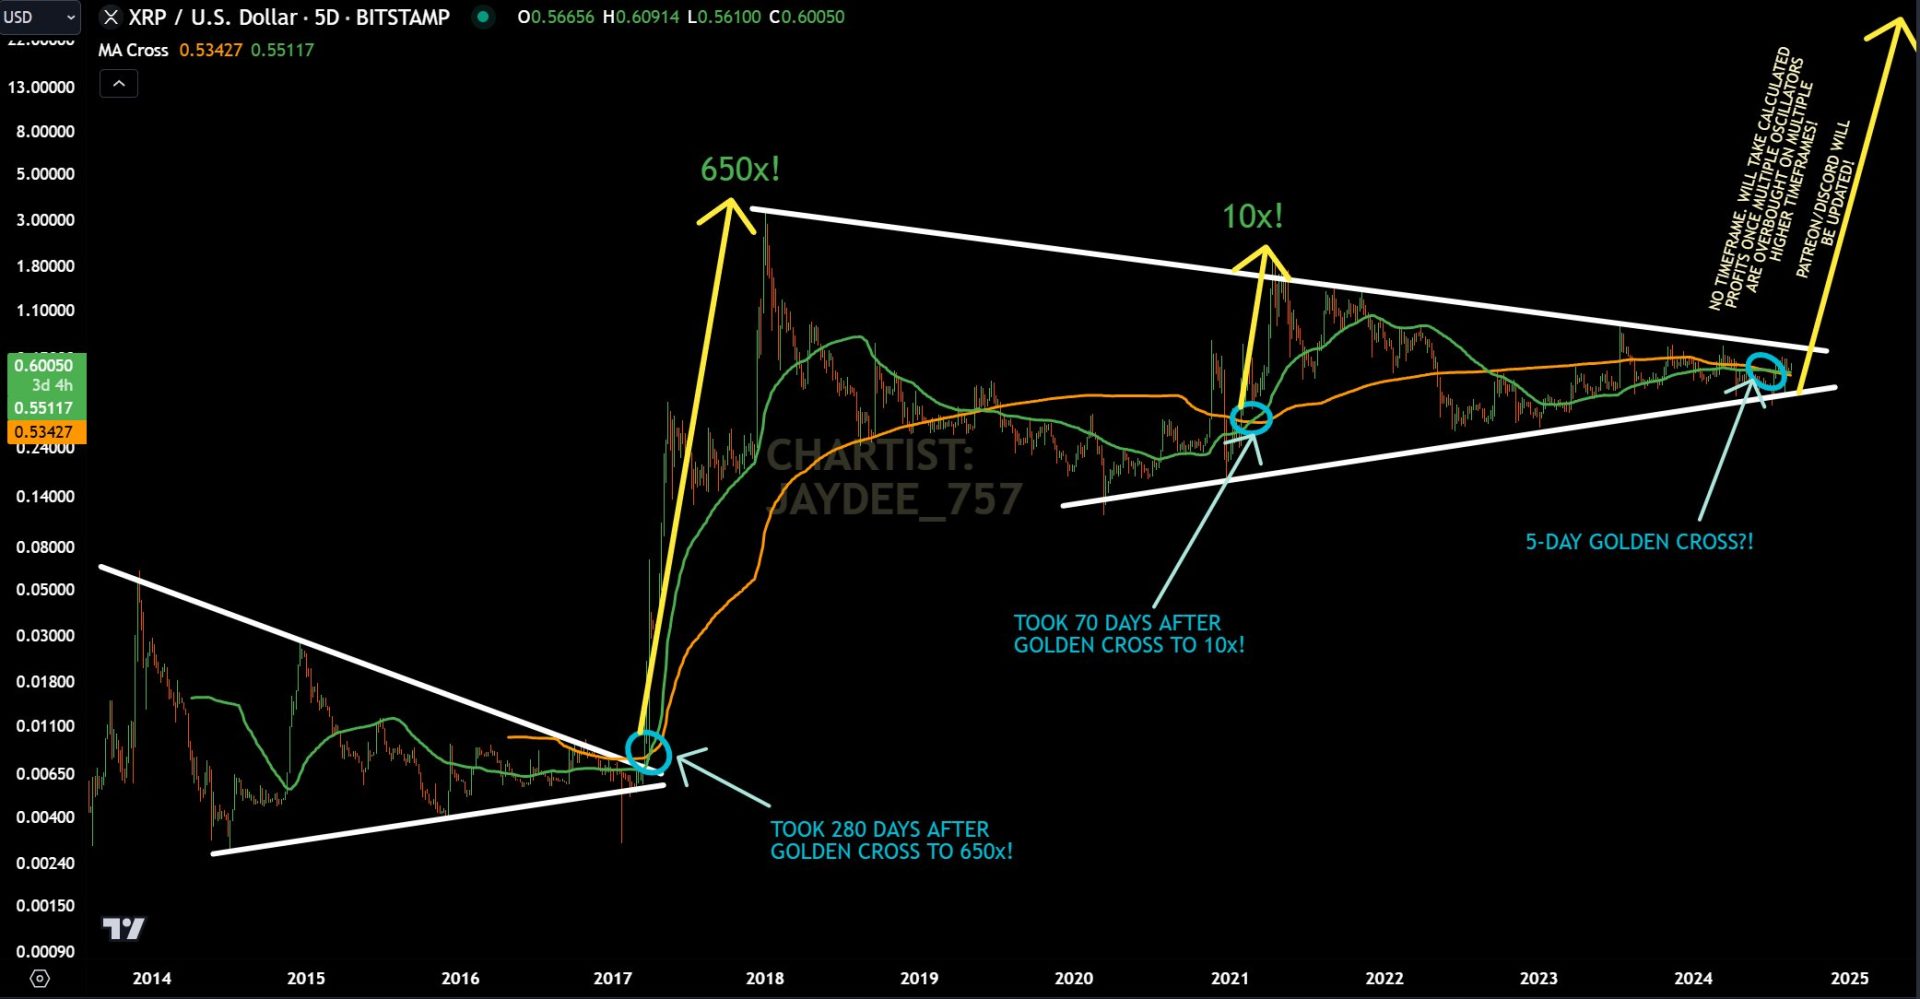
JD (@jaydee_757), one of the top crypto analysts on X, observed this pattern on a five-day chart, a timeframe that has historically preceded significant price rallies for XRP. JD highlighted two previous instances of golden crosses on the five-day chart.

In 2017, following a golden cross, XRP experienced a remarkable price increase of 650 times its initial value within 280 days. The subsequent surge propelled XRP to its all-time high.
In 2021, despite the ongoing legal challenges faced by Ripple, a golden cross on the same timeframe triggered a 10x price surge within 70 days, culminating in a peak of $1.96. Many believe XRP would have reached a new all-time high if not for the lawsuit.
Technical Analysis and Price Projections
JD further noted that XRP has been consolidating within a symmetrical triangle pattern, a chart formation often associated with periods of indecision before a significant price movement. The convergence of the trendlines at the apex of this triangle could trigger a substantial breakout.
Based on these observations, JD anticipates a potential price increase of 10x to 650x for XRP once the uptrend commences. While a 10x increase would position XRP at $6, a 650x surge could propel the price to $390.
We are on twitter, follow us to connect with us :- @TimesTabloid1
— TimesTabloid (@TimesTabloid1) July 15, 2023
Short-Term Outlook and Currently Market Conditions
In addition to the five-day analysis, another analyst, Xoom (@Mr_Xoom), identified a golden cross on the daily chart. While less dramatic than the five-day pattern, this signal is still considered bullish for the short term. Interestingly, XRP formed a similar golden cross in early February 2023, preceded by a 50% price increase.
XRP has recently rebounded from a downward trend, finding support near the S1 pivot point at $0.44921. The digital asset recently breached the $0.6 level but fell below again after facing resistance around $0.61. XRP is trading at $0.5938, down 0.43% over the past 24 hours.
Once XRP can successfully breach the $0.6 level, the next notable resistance levels from the Fibonacci pivot points are $0.65974 (R1), $0.72478 (R2), and $0.83004 (R3). Successfully breaching each resistance level could boost XRP’s momentum as it heads toward the next.
Disclaimer: This content is meant to inform and should not be considered financial advice. The views expressed in this article may include the author’s personal opinions and do not represent Times Tabloid’s opinion. Readers are urged to do in-depth research before making any investment decisions. Any action taken by the reader is strictly at their own risk. Times Tabloid is not responsible for any financial losses.
Follow us on Twitter, Facebook, Telegram, and Google News


