


XRP is trading at $2.1329, showing signs of bullish momentum after rebounding from the $2.00 support. The chart structure suggests growing buying pressure, with price action forming higher lows and holding above key technical levels.
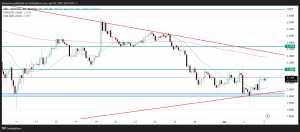
The $2.00 zone, marked by a blue support area, has proven resilient, rejecting multiple downside attempts. A red ascending trendline reinforces this level, creating an ascending triangle pattern with horizontal resistance at $2.20. This pattern typically favors an upward breakout if sustained buying pressure continues.
Moving Averages and Market Structure
The 50-period DEMA (Double Exponential Moving Average) has turned upward, supporting the bullish bias. Meanwhile, the 200-period EMA sits near $2.30, acting as a long-term resistance level. A golden cross—where the 50 DEMA moves above the 200 EMA—could further confirm a trend shift if price breaks higher.
- XRP faces two major resistance levels:
- $2.2006 – Immediate barrier within the triangle.
- $2.3713 – Converging with the 200 EMA and a descending trendline, making it a key breakout target.
Price action has remained above the 50 DEMA, reinforcing short-term bullish sentiment. However, a low-volume breakout could indicate weak buying conviction, increasing the risk of rejection.
Projected Move
If XRP breaks and holds above $2.20 with strong volume, it could rally toward $2.37. This move would validate the ascending triangle, signaling further upside potential.
We are on twitter, follow us to connect with us :- @TimesTabloid1
— TimesTabloid (@TimesTabloid1) July 15, 2023
Conversely, failure to clear $2.20 may lead to a retest of $2.00. A decisive break below this level would invalidate the bullish setup, exposing $1.95 as the next support.
XRP’s price action favors a breakout, with strong support and increasing momentum. A confirmed move above $2.20 could trigger a bullish continuation, while rejection may result in consolidation or downside pressure. Traders should watch volume and price reaction at key levels before making decisions.
Disclaimer: This content is meant to inform and should not be considered financial advice. The views expressed in this article may include the author’s personal opinions and do not represent Times Tabloid’s opinion. Readers are urged to do in-depth research before making any investment decisions. Any action taken by the reader is strictly at their own risk. Times Tabloid is not responsible for any financial losses.
Follow us on X, Facebook, Telegram, and Google News