

 Price Analysis: Market Gears Up for a Breakout – Key Levels to Watch")
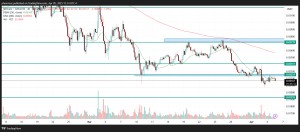
VeChain (VET) is currently trading at $0.02186, experiencing a minor 1% dip in the last 4-hour session. The chart reflects a market in consolidation after a steep decline, with signs that a short-term breakout may be imminent. With indicators showing momentum buildup, it’s essential to understand the critical levels and what price action could unfold next.
Trend Overview
On the 4-hour timeframe, VeChain remains in a downtrend but appears to be forming a base around the $0.02100–$0.02200 zone. After a sharp drop at the end of March, the market found support, and prices have since traded sideways—signaling accumulation.
While the larger trend is bearish, the recent price structure hints at a potential reversal or relief rally if key resistances are breached.
Support and Resistance Levels
- Key Support Zones:
- $0.02100: Current local support and the base of recent consolidation.
- $0.02000: Psychological and historical support; a break below this could signal deeper downside.
- Key Resistance Levels:
- $0.02250: Immediate resistance. A break above this would confirm bullish intent.
- $0.02400: Higher resistance; tested multiple times in late March.
- $0.02600: Mid-term bullish target if momentum sustains.
Technical Indicators
MACD (12, 26, 9):
- The MACD line (-0.00025) is crossing above the signal line (-0.00033) with the histogram turning positive at 0.00008.
- This crossover is a bullish signal, indicating that selling pressure has weakened and a possible rally could follow.
ADR (14):
- Average Daily Range is relatively low, suggesting price compression. Such phases often precede a volatile breakout.
Volume:
- Volume currently stands at 9.47 million, relatively stable but needs to rise significantly to support any major upside move.
- Look for a volume surge alongside resistance breakout for confirmation.
Price Action and Forecast: Next 48 Hours
The price is currently in a tight range with low volatility. With MACD turning bullish and ADR indicating consolidation, a breakout move is likely in the next 48 hours.
- Bullish Scenario:
If VET holds above $0.02100 and breaks $0.02250, expect a short-term rally toward $0.02400 and possibly $0.02600 if momentum builds.
- Bearish Scenario:
Failure to hold the $0.02100 support may trigger a move down to $0.02000 or even $0.01850.
We are on twitter, follow us to connect with us :- @TimesTabloid1
— TimesTabloid (@TimesTabloid1) July 15, 2023
VeChain is at a technical crossroads. After a strong downward move, it’s showing signs of stabilization and early momentum recovery. The MACD crossover and volume profile suggest the potential for an upside breakout. However, traders should wait for confirmation above $0.02250 before taking positions.
In the next 48 hours, watch the $0.02100–$0.02250 range closely—whichever side breaks may dictate the direction of VET’s next significant move.
Disclaimer: This content is meant to inform and should not be considered financial advice. The views expressed in this article may include the author’s personal opinions and do not represent Times Tabloid’s opinion. Readers are urged to do in-depth research before making any investment decisions. Any action taken by the reader is strictly at their own risk. Times Tabloid is not responsible for any financial losses.
Follow us on X, Facebook, Telegram, and Google News