


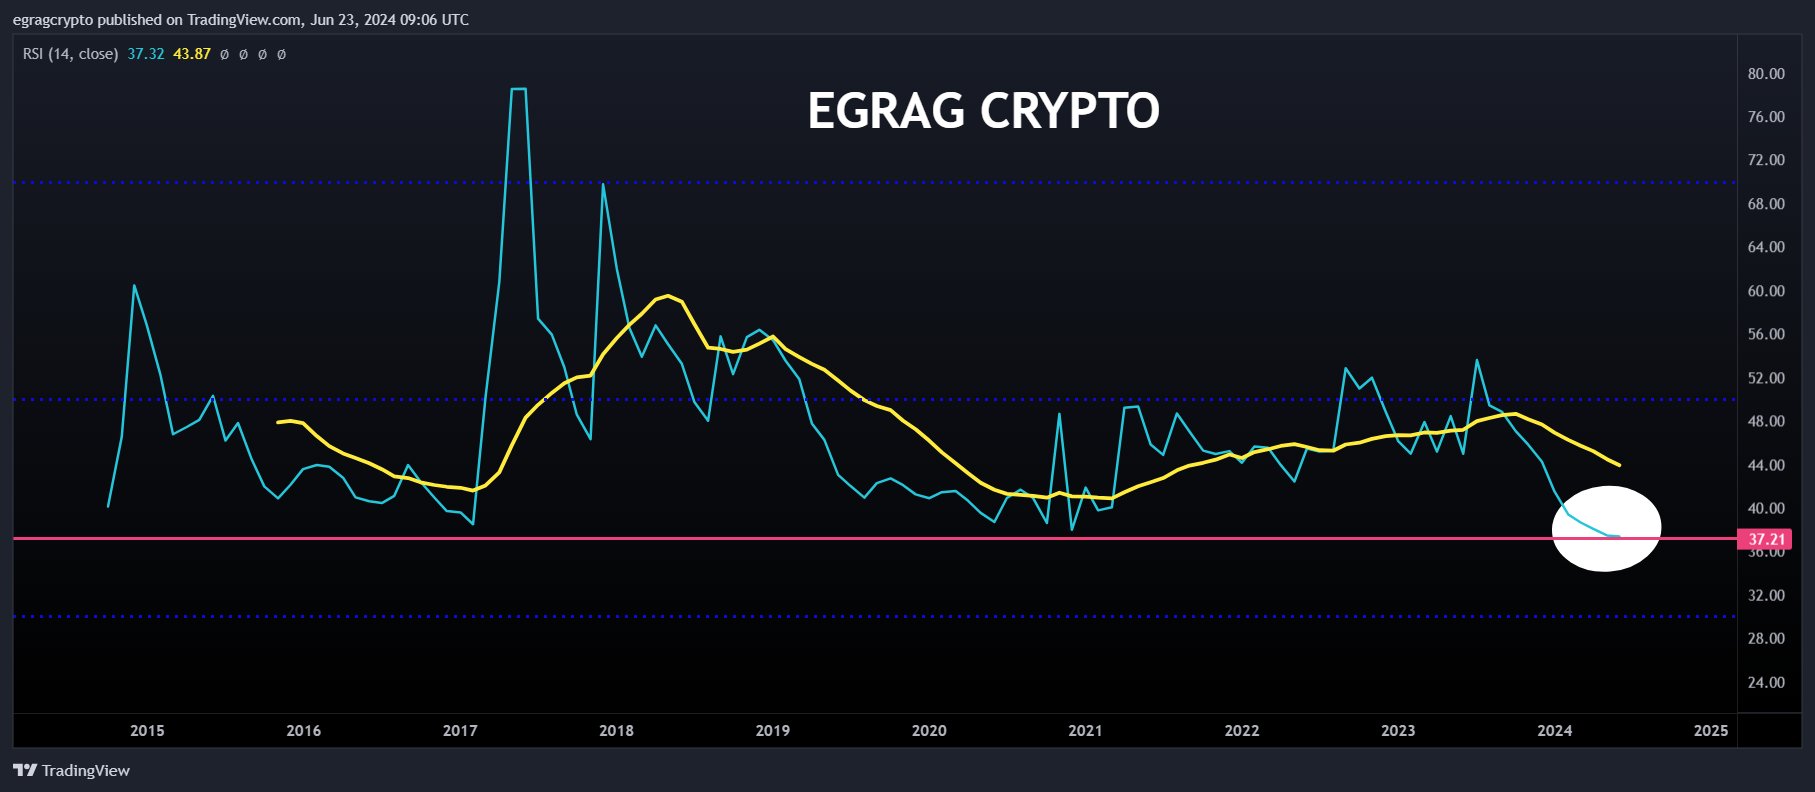
EGRAG CRYPTO (@egragcrypto), a well-known analyst on X, has identified a significant development in the XRP/BTC chart. According to his analysis, the monthly Relative Strength Index (RSI) for XRP/BTC has reached its lowest point in history.
The RSI is a technical indicator used to gauge the momentum of price movements and identify potential overbought or oversold conditions.
Read Also: XRP Hits Correction Target Zone, Analyst Foresees $3.47 Price. Here’s His Chart
The analyst highlights that the current RSI reading for XRP/BTC falls below the level observed even during the “Black Swan” event of 2020, a period of extreme market volatility triggered by the COVID-19 pandemic. This suggests that XRP has never been more oversold relative to Bitcoin on a monthly time frame.
EGRAG CRYPTO interprets this extreme oversold condition as a potential precursor to a significant price reversal. He draws a parallel to historical price movements, suggesting that a similar magnitude of change could occur in the opposite direction, propelling the XRP/BTC pair into the overbought territory on the RSI.
Understanding the RSI and its Implications
The RSI is a valuable tool for technical analysts, providing insights into the strength or weakness of a particular asset’s price movements. It typically ranges from 0 to 100, with readings above 70 generally indicative of overbought conditions and readings below 30 suggesting oversold conditions.
In the context of the XRP/BTC pair, the historically low RSI reading suggests that the selling pressure on XRP relative to Bitcoin has been intense. This could be due to a combination of factors, including broader market sentiment toward cryptocurrencies or specific developments related to XRP.
XRP achieved a similar feat on the monthly chart in May, but EGRAG CRYPTO’s post suggests XRP might have hit a lower RSI.
We are on twitter, follow us to connect with us :- @TimesTabloid1
— TimesTabloid (@TimesTabloid1) July 15, 2023
Read Also: Analyst Spots XRP Cup-Handle Pattern On Weekly Chart, Sets Bullish Target
Interpreting the Analyst’s Prediction
The analyst’s prediction of a potential reversal hinges on the notion that the current oversold condition is unsustainable. Historically, oversold readings on the RSI have often been followed by periods of price consolidation or even price increases. This is because extreme selling pressure can eventually become exhausted, leading to a reversal in momentum.
EGRAG CRYPTO’s observation regarding the XRP/BTC RSI reaching an all-time low on the monthly timeframe presents an interesting bullish indicator for investors. EGRAG CRYPTO also recently showed a potential full reset of XRP’s Stoch-RSI, potentially leading to a massive price surge.
Disclaimer: This content is meant to inform and should not be considered financial advice. The views expressed in this article may include the author’s personal opinions and do not represent Times Tabloid’s opinion. Readers are urged to do in-depth research before making any investment decisions. Times Tabloid is not responsible for any financial losses.
Follow us on Twitter, Facebook, Telegram, and Google News