


Shiba Inu (SHIB) is trading around $0.00001487 with minor price fluctuations. Over the last 24 hours, SHIB has shown a slight upward movement of 0.1%, indicating a period of consolidation after recent volatility. With SHIB hovering near its resistance and support levels across multiple time frames, traders are closely watching for its next breakout or breakdown.
Key Support and Resistance Levels
15-Minute Chart
- Support Levels: $0.00001369, $0.00001269
- Resistance Levels: $0.00001531, $0.00001955
The 15-minute chart indicates minor fluctuations, with resistance at $0.00001531, which aligns with a 0.618 Fibonacci retracement level. If SHIB can break above this level, it could push toward the $0.00001955 target. However, if it fails, support at $0.00001369 will be critical.
1-Hour Chart
- Support Levels: $0.00001299, $0.00001248
- Resistance Levels: $0.00001386
The 1-hour time frame presents a tighter range. Resistance at $0.00001386 has been tested multiple times. A strong breakout above this level could confirm an upward trend, while a drop below $0.00001299 could signal further downside pressure.
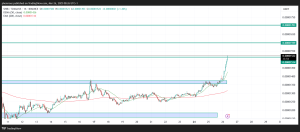
4-Hour Chart
- Support Levels: $0.000012, $0.000010
- Resistance Levels: $0.000015, $0.000021
The broader 4-hour analysis suggests that SHIB’s major resistance at $0.000015 is a significant hurdle for bulls. If broken, the next target would be $0.000021. Meanwhile, strong support at $0.000012 could help prevent further declines.
We are on twitter, follow us to connect with us :- @TimesTabloid1
— TimesTabloid (@TimesTabloid1) July 15, 2023
Next Move Prediction
Considering the current trend, SHIB is trading near its short-term resistance. A breakout above $0.00001531 could trigger a rally toward $0.00001955, driven by increasing bullish sentiment. However, if SHIB fails to break above resistance, a pullback toward $0.00001299 or even $0.000012 is likely.
- Bullish Scenario: If SHIB closes above $0.000015, we could see a short-term rally to $0.00001955.
- Bearish Scenario: Failure to break resistance could lead to a decline toward $0.000012, or even $0.000010 in a worst-case scenario.
Traders should watch volume trends and market sentiment closely to confirm the next move.
Disclaimer: This content is meant to inform and should not be considered financial advice. The views expressed in this article may include the author’s personal opinions and do not represent Times Tabloid’s opinion. Readers are urged to do in-depth research before making any investment decisions. Any action taken by the reader is strictly at their own risk. Times Tabloid is not responsible for any financial losses.
Follow us on X, Facebook, Telegram, and Google News