


Shiba Inu (SHIB) is trading around $0.00001321, moving within a tight range as traders anticipate its next breakout or breakdown. With key resistance and support zones being tested, the immediate trend is uncertain. By analyzing the 4-hour, 1-hour, and 15-minute charts, we can pinpoint potential price movements and key levels to watch.
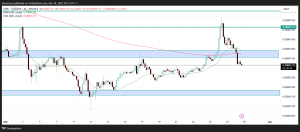
4-Hour Chart Breakdown
SHIB recently attempted a breakout from a descending wedge, a pattern often associated with bullish reversals. However, price action remains constrained beneath a strong resistance at $0.000021. If buyers step in and break through this level, SHIB could rally toward $0.000025. Failure to sustain momentum, however, might lead to another dip, testing the $0.00001369 support level.
1-Hour Chart Signals
On the 1-hour chart, SHIB’s movement is at a crucial crossroads. The price is hovering near a key resistance zone within the wedge pattern, presenting two potential outcomes:
- Bullish Breakout: A push above $0.00001531 with strong volume could confirm a trend reversal, setting sights on $0.00001955.
- Bearish Rejection: If resistance holds firm, SHIB may retreat, with $0.00001369 acting as the first major support level.
Momentum indicators suggest a possible upside move, but confirmation is required before committing to a direction.
15-Minute Chart Short-Term Outlook
In the 15-minute timeframe, SHIB is consolidating around the middle Bollinger Band, signaling low volatility before a potential breakout. Immediate resistance remains at $0.00001531, aligning with Fibonacci retracement levels. A break higher could spark a rapid price surge, while failure may lead to another test of support at $0.00001369.
We are on twitter, follow us to connect with us :- @TimesTabloid1
— TimesTabloid (@TimesTabloid1) July 15, 2023
- Key Support and Resistance Levels
- Support: $0.00001369, then $0.00001269
- Resistance: $0.00001531, then $0.00001955
Predicted Price Action and Market Sentiment
SHIB is at a pivotal point, with a breakout above $0.00001531 potentially leading to a rally toward $0.00001955. If bullish momentum fades, expect a retest of $0.00001369 or lower. Overall, SHIB’s short-term trend hinges on its ability to break resistance or sustain its support zones.
Disclaimer: This content is meant to inform and should not be considered financial advice. The views expressed in this article may include the author’s personal opinions and do not represent Times Tabloid’s opinion. Readers are urged to do in-depth research before making any investment decisions. Any action taken by the reader is strictly at their own risk. Times Tabloid is not responsible for any financial losses.
Follow us on X, Facebook, Telegram, and Google News