


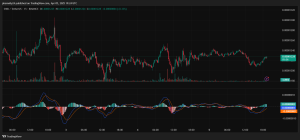
The Shiba Inu (SHIB) 1-hour chart shows range-bound activity with notable volatility. Price currently trades at $0.00001214, marking a 1.30% decline. SHIB is consolidating near a crucial demand zone.
Support and Resistance
Key support lies at $0.00001180, where prior price rejections occurred. This zone has historically attracted buyers, stabilizing price dips. Resistance sits at $0.00001260 and $0.00001300—levels where bullish attempts have repeatedly failed. A breakout above these could trigger bullish momentum.
Technical Indicators
The MACD (12, 26) reflects indecision. The MACD line slightly lags behind the signal line, indicating waning momentum. Histogram bars are neutral, suggesting a potential pause or shift in trend. Although there is no strong bullish crossover yet, selling pressure appears to be weakening.
Bollinger Bands are tightening, indicating reduced volatility. Price is hovering near the lower band, suggesting a possible bounce or short-term reversal. A breakout from this squeeze will likely set the next directional move.
Chart Patterns and Trend
SHIB has formed lower highs and consistent support bounces, shaping a mild descending triangle on the hourly chart. This suggests weakening bullish strength but doesn’t confirm a breakdown. Short wicks on lower candles show persistent dip buying.
Price Action & Projection (Next 3 Days)
If SHIB breaks below $0.00001180, it may test $0.00001140. On the upside, a close above $0.00001260 opens the door to $0.00001320. Consolidation between $0.00001200 and $0.00001250 remains likely short-term.
We are on twitter, follow us to connect with us :- @TimesTabloid1
— TimesTabloid (@TimesTabloid1) July 15, 2023
Fundamental Insight
SHIB’s ecosystem development—including Shibarium adoption and token burns—continues to build long-term sentiment. However, macro uncertainty and Bitcoin’s consolidation weigh on meme coin performance.
SHIB remains in consolidation. Traders should watch for a breakout from the triangle pattern and Bollinger Band squeeze. A bullish close above $0.00001260 may confirm momentum toward $0.00001320, while a breakdown below support could trigger downside toward $0.00001140.
Disclaimer: This content is meant to inform and should not be considered financial advice. The views expressed in this article may include the author’s personal opinions and do not represent Times Tabloid’s opinion. Readers are urged to do in-depth research before making any investment decisions. Any action taken by the reader is strictly at their own risk. Times Tabloid is not responsible for any financial losses.
Follow us on X, Facebook, Telegram, and Google News