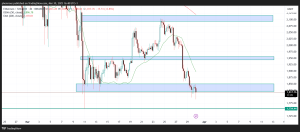
Ethereum (ETH) is trading at around $1,817.44, reflecting a recent 2.4% decline. Despite this dip, ETH remains a crucial asset in the crypto market, with traders analyzing its price movements to gauge the next trend.

Price Action Across Timeframes
Daily Chart
ETH is consolidating near the 100-day Simple Moving Average (SMA), indicating market indecision. A strong support level at $1,823.88 suggests buyers are stepping in, but resistance at $1,976.97 could hinder upward momentum.
4-Hour Chart
ETH is trading above the 50-period SMA on the 4-hour chart, hinting at short-term bullish strength. Holding above this level may support further gains in the coming sessions.
Weekly Chart
The weekly timeframe shows ETH sustaining levels above the 200-period SMA, reinforcing its long-term uptrend. However, a decisive move past $2,100 is required for a significant rally.
Key Support and Resistance Levels
- Support: $1,823.88, $1,768.35 , $1,670.78
- Resistance: $1,976.97, $2,074.53, $2,130.06
We are on twitter, follow us to connect with us :- @TimesTabloid1
— TimesTabloid (@TimesTabloid1) July 15, 2023
Potential Price Movement
ETH could see a 5% rise in the next month, reaching around $1,837.84. A breakout past $2,100 might fuel a surge toward $4,000, while a failure to hold support may push ETH toward $1,700.
As cryptocurrency markets are highly volatile, traders should conduct independent research and use proper risk management strategies before making investment decisions.
Disclaimer: This content is meant to inform and should not be considered financial advice. The views expressed in this article may include the author’s personal opinions and do not represent Times Tabloid’s opinion. Readers are urged to do in-depth research before making any investment decisions. Any action taken by the reader is strictly at their own risk. Times Tabloid is not responsible for any financial losses.
Follow us on X, Facebook, Telegram, and Google News


