

 Faces Key Technical Rejection. Here’s The Implication")
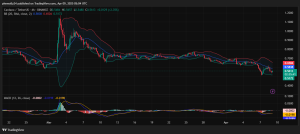
Market Overview
- Current Price: $0.5613
- Timeframe: 4H (Breakdown into 1H and 15min)
- Trend: Bearish but showing signs of possible rebound
- Volume Context: Price action suggests seller exhaustion; wicks at key levels
Indicators Used
- Bollinger Bands (20, 2)
- MACD (12, 26, 9)
- EMA 20 and 50
- Candlestick Price Patterns
Pattern Analysis (Multi-Timeframe)
- Descending Channel Break Potential (4H)
ADA is moving inside a descending channel, which may see a bullish breakout if $0.55–$0.56 flips.
Price has tagged the lower Bollinger Band and bounced back — a typical reversal zone.
- Morning Star Formation (1H)
On the 1H timeframe, we’re seeing the early signs of a morning star pattern (bearish candle → doji → bullish candle).
If confirmed, it signals a potential short-term reversal from the current low.
- Falling Wedge on 15-Minute Chart
A falling wedge pattern, which is typically bullish, is forming in the 15m view.
A breakout above $0.5520 could kick off a mini rally, targeting the mid-Bollinger range.
Indicator Breakdown
- Bollinger Bands
Price is hugging the lower band on 4H, signaling potential reversion to the mean (EMA 20 at $0.5832).
In 15m, the bands are narrowing, suggesting volatility expansion ahead.
- MACD
4H MACD: Bearish but histogram shows shrinking red bars, indicating momentum loss.
1H MACD: Bullish crossover may form within next candle.
15m MACD: Has already crossed bullish and histogram has flipped green.
- EMA Support/Resistance
EMA 20 (4H): $0.5832 (short-term resistance and reversion level)
EMA 50 (4H): ~$0.65 (major resistance)
Price is currently below both EMAs, but a bounce could test the EMA 20.
- Price Action
Major wick at $0.5155, suggesting strong buyer interest.
Sellers failed to push lower on recent attempts — signaling exhaustion.
We are on twitter, follow us to connect with us :- @TimesTabloid1
— TimesTabloid (@TimesTabloid1) July 15, 2023
Key Levels to Watch
- Support Levels:
- $0.5155 – Major support (tested and held)
- $0.5000 – Psychological support
- $0.4750 – Last structural low (if breakdown continues)
- Resistance Levels:
- $0.5832 (EMA 20) – Immediate resistance
- $0.6000 – Horizontal and psychological resistance
- $0.6508 (EMA 50) – Strong upper boundary if bulls regain momentum
12-Hour Price Projection (April 9, 4:00–16:00 UTC)
- Scenario: Short-Term Rebound Expected
- Projection:
- 4:00–8:00 UTC: Sideways grind or minor dip toward $0.5350, then bounce
- 8:00–12:00 UTC: Breakout from falling wedge → test of $0.5650–$0.5830
- 12:00–16:00 UTC: Possible continuation if volume enters, testing $0.6000 max
Cardano (ADA) is showing signs of bearish momentum fading. If $0.5155 holds, a 12-hour relief rally is expected, potentially pushing ADA back toward $0.58–$0.60. Confirmation would require a breakout of the falling wedge and a candle close above $0.56.
This is a critical window for bulls to reclaim EMA levels and flip trend structure short-term.
Disclaimer: This content is meant to inform and should not be considered financial advice. The views expressed in this article may include the author’s personal opinions and do not represent Times Tabloid’s opinion. Readers are urged to do in-depth research before making any investment decisions. Any action taken by the reader is strictly at their own risk. Times Tabloid is not responsible for any financial losses.
Follow us on X, Facebook, Telegram, and Google News