


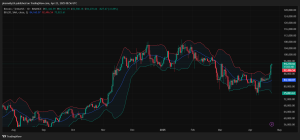
Bitcoin (BTC) is currently trading at $94,270, following a strong breakout on the daily timeframe. After weeks of sideways movement, price action has exploded past the $88,000 resistance zone with force. A bullish daily candle has closed well above the upper Bollinger Band, confirming the momentum shift. The 20-day SMA, now sloping upward, reinforces this trend reversal. This breakout is the first decisive bullish move since Bitcoin’s post-halving consolidation began earlier this month.
Bollinger Bands Signal Rising Momentum
The daily Bollinger Bands are expanding—an early signal of increased volatility and trend strength. Price is comfortably above the middle band at $84,121, with the lower band resting at $75,968. Historically, breakouts above the upper band during expansion phases often precede extended rallies. As momentum builds, the current trend structure suggests that bulls are preparing to test higher resistance levels.
4-Hour Chart Shows Bull Flag Resolution
On the 4-hour chart, Bitcoin recently broke out from a textbook bull flag—one of the most reliable continuation patterns. After an initial surge, BTC consolidated in a downward-sloping range before breaking out above $88,000. The move was supported by a volume spike, confirming strong buyer interest. This pattern adds confidence that the breakout has room to run, supported by a clean market structure and bullish symmetry.
1-Hour Trend Shows Healthy Momentum
The 1-hour chart highlights a strong, controlled uptrend. Bitcoin is consistently printing higher highs and higher lows, respecting the upper Bollinger Band. Minor dips have been quickly bought up, especially near the $90,000 level, now acting as intraday support. This timeframe shows that short-term traders are actively buying strength and defending key levels—clear signs of bullish market control.
We are on twitter, follow us to connect with us :- @TimesTabloid1
— TimesTabloid (@TimesTabloid1) July 15, 2023
Macro and On-Chain Support
Fundamentals are reinforcing the technical rally. A recent U.S. CPI miss has reignited hopes for a Fed rate cut, weakening the dollar and boosting demand for alternative stores of value like Bitcoin. Additionally, Bitcoin’s recent halving has reduced new supply, tightening market conditions. On-chain metrics reveal declining exchange reserves and renewed whale accumulation—both signals of long-term bullish positioning.
Trade Setup for Today
For today’s session, an ideal entry lies around $92,500 on a short pullback. The first target (TP1) is $96,000, with $100,000 as a possible second target (TP2) if momentum continues. A prudent stop loss is $88,500—just below the breakout level and the 20-day SMA. This setup offers a favorable risk-reward profile, aligning both technical and fundamental.
Today’s Bitcoin (BTC) Outlook
Bitcoin is likely to sustain its upward move today, supported by breakout volume, macro tailwinds, and bullish technical structure across all major timeframes. If the $92,500 level holds, the price could push toward $96,000 before the daily close. Consolidation above this zone would set the stage for a test of $100,000. Overall, today’s trend remains decisively bullish, with dips presenting strong buying opportunities.
Disclaimer: This content is meant to inform and should not be considered financial advice. The views expressed in this article may include the author’s personal opinions and do not represent Times Tabloid’s opinion. Readers are urged to do in-depth research before making any investment decisions. Any action taken by the reader is strictly at their own risk. Times Tabloid is not responsible for any financial losses.
Follow us on X, Facebook, Telegram, and Google News