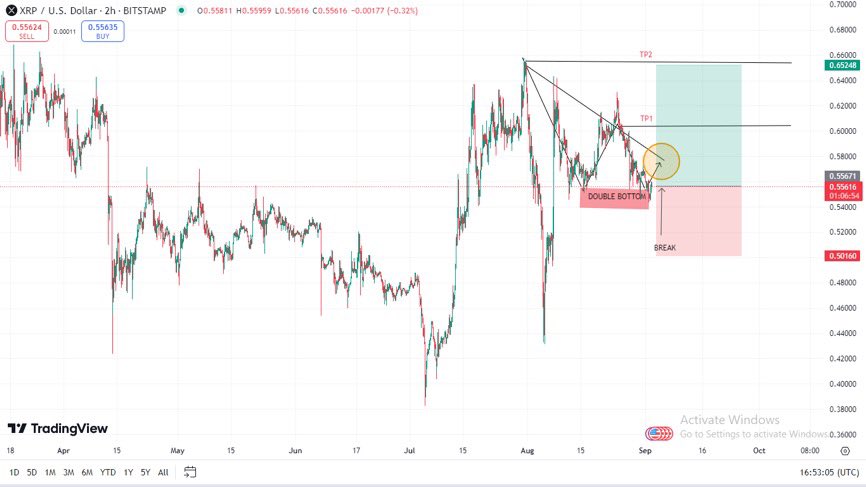
In technical analysis, few patterns are as significant as the Double Bottom, a formation that often hints at a potential reversal in a downtrend.
Brett Crypto, a recognized brand ambassador for Bitrue, recently highlighted this pattern on the XRP/USD chart, suggesting that a bullish trend could be imminent.

The Double Bottom Pattern
The Double Bottom is a bullish reversal pattern that appears after an extended downtrend. It is characterized by two distinct troughs at approximately the same level, separated by a peak. This pattern reflects a market scenario where selling pressure has been exhausted, leading to a potential shift from a bearish to a bullish trend.
In the case of XRP/USD, as observed by Brett Crypto, the Double Bottom is visible on the 2-hour chart, reinforcing the likelihood of upward momentum. The two troughs represent points of support where buyers have consistently stepped in, preventing further declines. The peak between these troughs acts as a level of resistance that, once broken, signals a possible reversal.
Breakout and Confirmation
According to the chart attached in Brett Crypto’s analysis, XRP has successfully broken above the resistance level formed by the peak between the two bottoms. This breakout is crucial as it confirms the double-bottom pattern and strengthens the case for a bullish reversal.
Moreover, the breakout was accompanied by a retest of the previous resistance level, which is now turned into support. This behavior is a common characteristic of a strong breakout that validates the bullish outlook. Traders often look for such retests as confirmation before entering long positions.
We are on twitter, follow us to connect with us :- @TimesTabloid1
— TimesTabloid (@TimesTabloid1) July 15, 2023
Price Targets and Risk Management
Brett Crypto has identified two key price targets (TP1 and TP2) for XRP/USD. The first target, TP1, is set around the $0.61 level, while TP2 nears $0.65.
The zone around $0.61 represents a crucial resistance level, previously established during earlier price movements. If XRP/USD breaches this level, it could pave the way for further gains towards $0.65, marking a significant recovery from recent lows.
On the flip side, Brett has also highlighted the importance of risk management. The chart indicates a stop-loss level below the support zone around $0.50. This stop-loss placement is strategic. It ensures that any potential downside is minimized in case the breakout fails and the bearish trend resumes.
Disclaimer: This content is meant to inform and should not be considered financial advice. The views expressed in this article may include the author’s personal opinions and do not represent Times Tabloid’s opinion. Readers are urged to do in-depth research before making any investment decisions. Any action taken by the reader is strictly at their own risk. Times Tabloid is not responsible for any financial losses.
Follow us on Twitter, Facebook, Telegram, and Google News


