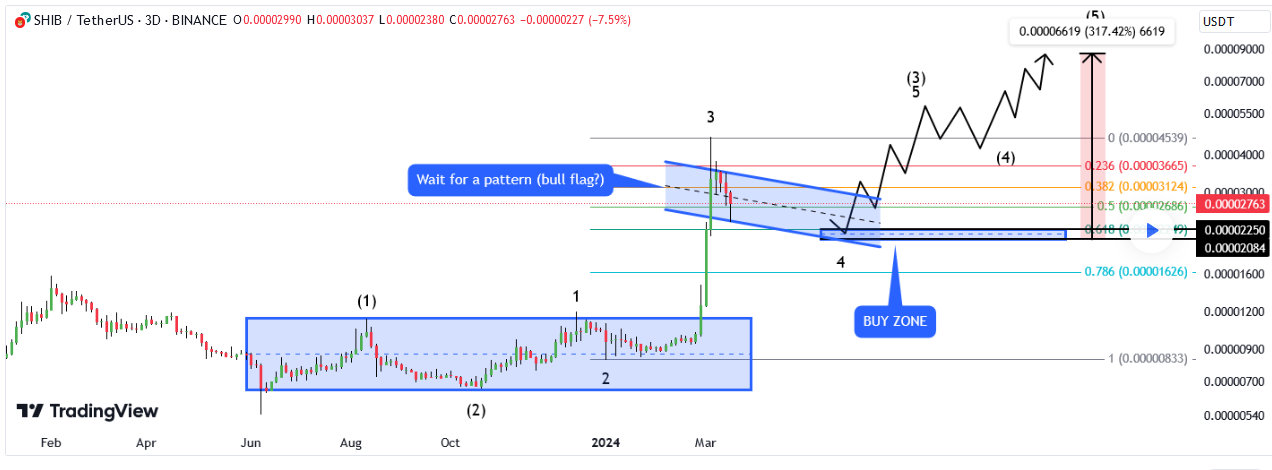
Despite recent losses, market analyst Xanrox maintains a bullish outlook for Shiba Inu (SHIB), pinpointing a potential buying opportunity tied to the Fibonacci 0.618 level. His analysis suggests that SHIB could bounce back strongly, offering a significant rally if the anticipated entry price is reached.
The wider cryptocurrency market downturn has also affected Shiba Inu, pushing it 12% lower in the past week and resulting in retests of previous support levels. However, Xanrox’s analysis, initially presented on March 17th, reveals a longer-term potential for a reversal.

Analysis Based on Elliott Wave Theory
Xanrox identifies a five-wave Elliott Wave pattern in Shiba Inu’s price action since June 2023. This suggests the current downturn may be part of the third wave within this structure. His chart indicates that a bullish flag formation could occur following a further price decline to the Fibonacci 0.618 retracement level. This key level aligns with a price of $0.00002249, offering a potential buying opportunity.
The Path to a Major Rally
If SHIB successfully reaches the predicted entry point, Xanrox anticipates a price surge to $0.00005724 – a movement completing the third Elliott Wave. While a brief corrective movement to $0.00004159 is possible, the broader pattern suggests a subsequent reversal and continuation of the uptrend. This fifth wave could propel Shiba Inu towards a target price of $0.00008588, representing a substantial 317% increase from the expected low point.
We are on twitter, follow us to connect with us :- @TimesTabloid1
— TimesTabloid (@TimesTabloid1) July 15, 2023
SHIB’s Potential Reversal After Price Decline
Analyst Xanrox anticipates a further short-term decline in Shiba Inu’s price before a potential trend reversal. In a follow-up analysis on March 18th, he highlighted the $0.00008845 all-time high as the sole major resistance point on the weekly chart.
Data from IntoTheBlock reveals that SHIB faces three sell walls on its path toward recovering its all-time high (ATH) of $0.00008845.
While these obstacles exist, they appear less formidable than those the asset has surpassed in the past. The first sell wall lies between $0.000039 and $0.000046, with 29,780 addresses holding a total of 3.52 trillion SHIB. The second wall exists within the $0.000046 to $0.000057 price range. The third and final wall has an average price of $0.000067 and peaks at $0.000131.
Follow us on Twitter, Facebook, Telegram, and Google News


