


XRP is trading at approximately $2.12, reflecting a slight decline of 0.95% over the past 24 hours. The cryptocurrency remains in an overall uptrend but faces potential resistance and a critical pattern formation that could determine its next move.
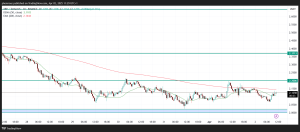
Daily Chart Analysis: Caution Amid an Uptrend
On the daily timeframe, XRP has been trading within an ascending channel, characterized by higher highs and higher lows, which indicates a continued bullish trend. However, a potential ‘Head and Shoulders’ pattern is forming, signaling a possible bearish reversal. If this pattern plays out, analysts expect XRP to decline towards $1.15, aligning with key Fibonacci retracement zones. A break below $2.00 would confirm the pattern, adding downside pressure to the market.
4-Hour Chart Analysis: Bullish Structure in Play
The 4-hour chart presents a contrasting scenario with a bullish Gartley pattern forming near a strong support zone. If this pattern holds, XRP could see a strong bounce toward the $2.30–$2.50 range in the short term. Additionally, XRP remains within an ascending channel on this timeframe, suggesting a potential 20% surge if it continues respecting higher highs and higher lows.
1-Hour Chart Analysis: Consolidation Before a Major Move
In the 1-hour timeframe, XRP is consolidating between $2.27 and $2.44, forming a tight trading range. This range-bound movement often precedes significant price breakouts, making it crucial for traders to watch closely. A breakout above $2.44 could push XRP towards the $2.50-$2.70 region, while a breakdown below $2.27 might lead to a retest of lower support zones.
We are on twitter, follow us to connect with us :- @TimesTabloid1
— TimesTabloid (@TimesTabloid1) July 15, 2023
Projected Next Price Target
Given the mixed signals from different timeframes, XRP’s next price move depends on key breakouts:
- Bullish Scenario: If XRP holds above $2.27 and breaks past $2.44, the next target is $2.50–$2.70.
- Bearish Scenario: If XRP loses support at $2.00, a drop towards $1.15 becomes a possibility.
Traders should monitor these levels closely and adjust their strategies accordingly.
Disclaimer: This content is meant to inform and should not be considered financial advice. The views expressed in this article may include the author’s personal opinions and do not represent Times Tabloid’s opinion. Readers are urged to do in-depth research before making any investment decisions. Any action taken by the reader is strictly at their own risk. Times Tabloid is not responsible for any financial losses.
Follow us on X, Facebook, Telegram, and Google News