


XRP has exhibited signs of a potential price surge in the coming days, with analysts pointing to a breakout on the 12-hour chart as a key indicator.
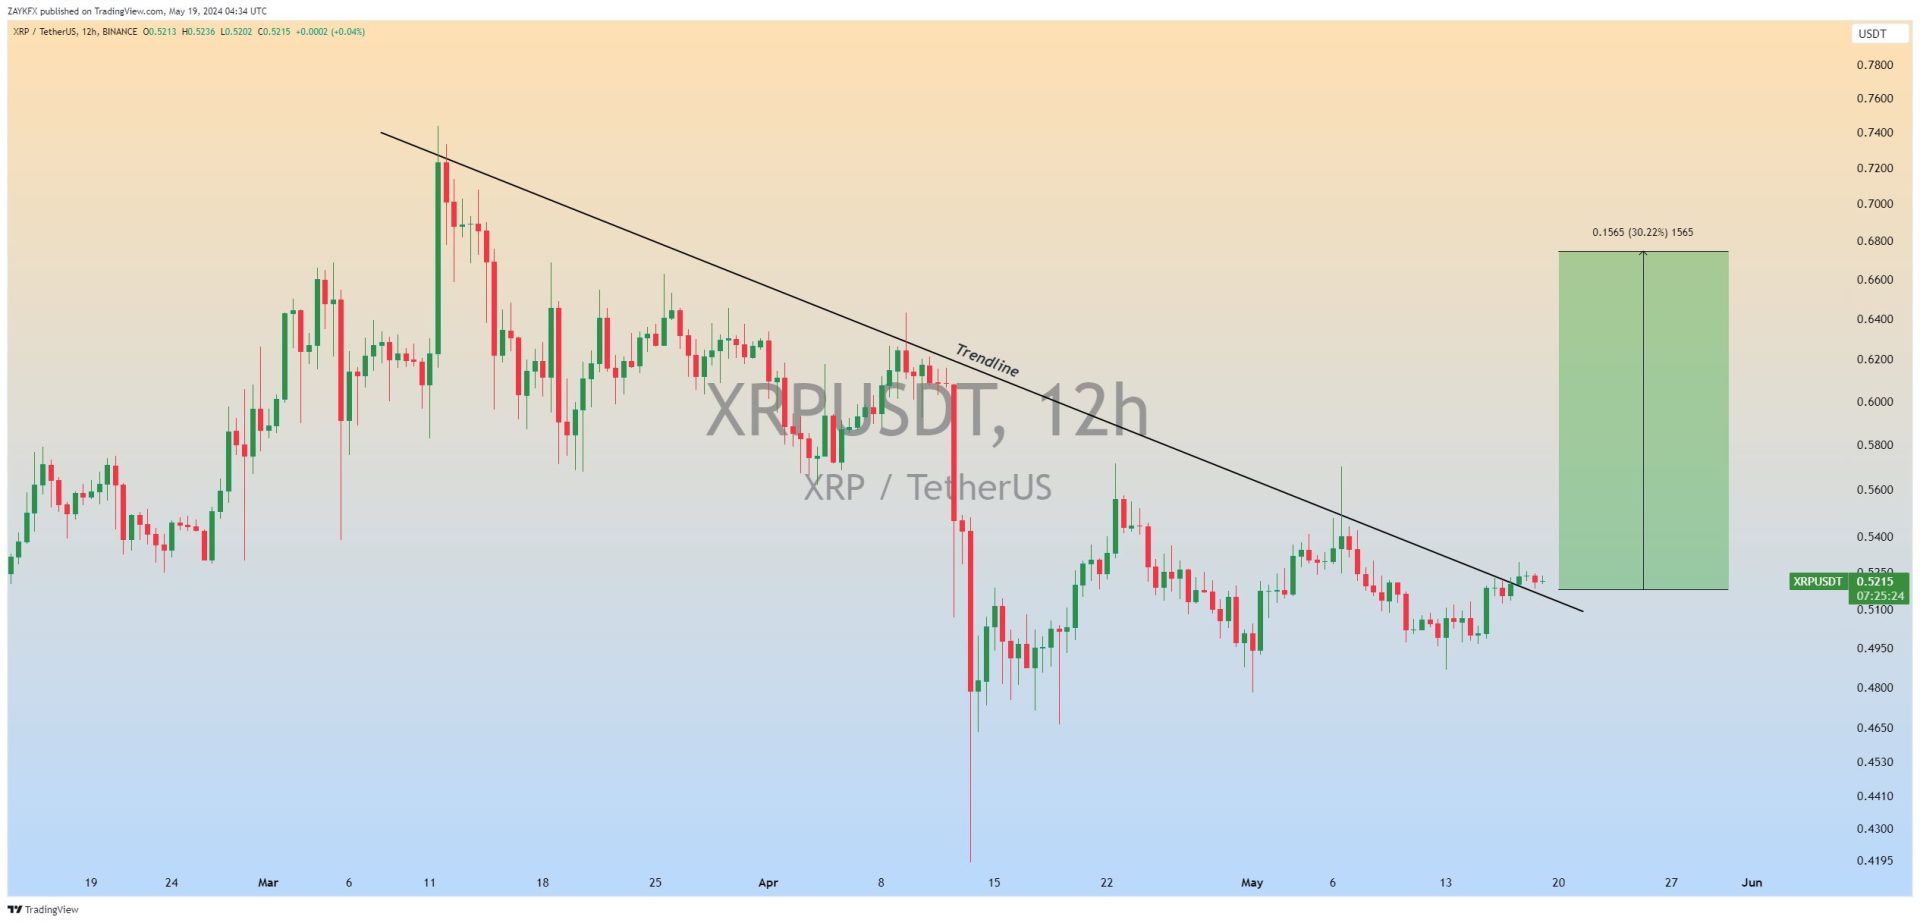
The recent analysis by ZAYK Charts (@ZAYKCharts) suggests a bullish wave of 20-30% for XRP, with a target zone of $0.68 if the uptrend materializes. This prediction is based on the recent breakout of a crucial trendline on the 12-hour timeframe for the XRP/USDT trading pair.
Read Also: Machine Learning Model Predicts XRP Price for April 30, 2024
Signs of a Breakout in XRP’s Performance
Technical analysis has renewed optimism around XRP, and the digital asset’s performance over the past 24 hours has reinforced this optimism. XRP has climbed 1.01% to $0.5361. XRP reached a weekly high of $0.5541 in the later hours of May 21 before a slight correction sent it to its current price.
Despite some recent fears of the SEC potentially appealing the lawsuit, XRP is also up 6.04% over the past week, and this renewed bullish momentum could be a sign of better things to come.
XRP’s trading volume also shows investor confidence, up 108.10% over the past 24 hours to $2.19 billion. This sharp rise in trading activity indicates continued investor interest in XRP, and could also be a precursor to the surge predicted by ZAYK Charts. Further market data analysis reveals an increase in XRP’s open interest, climbing 4.41% to $631.82 million at press time.
Key Support and Resistance Levels
On the 4-hour chart, XRP is currently positioned around the 38.2% Fibonacci retracement level, which is considered a support zone. This indicates that the coin is finding some stability after the recent dip. More importantly, XRP has successfully held above the crucial $0.5 support level, last touched on May 15.
The immediate hurdle for XRP appears to be the $0.55 resistance level. If the bulls can overcome this barrier, the next target zone could be the 78.6% Fibonacci level, potentially leading to a test of the critical $0.57 resistance, last seen in April.
We are on twitter, follow us to connect with us :- @TimesTabloid1
— TimesTabloid (@TimesTabloid1) July 15, 2023
Read Also: As XRP Shows Signs of Recovery, Analyst Pinpoints Key Support and Resistance Levels to Watch
Conversely, a failure to breach the $0.55 resistance could lead to a price drop back towards the $0.5 support zone. A break below this level could trigger further declines, potentially reaching the May low. However, analysts are confident in XRP’s future, with predictions that XRP could reach $1 soon.
XRP’s technical indicators also support the bullish sentiment. Although its Oscillators are neutral, the Moving Averages show a buy signal, and TradingView’s summary shows a buy signal.
Follow us on Twitter, Facebook, Telegram, and Google News